Why S3-Routed Reads Make Latency Worse as Your Cluster Grows
Independent caches across nodes multiply S3 misses and tail-latency spikes as clusters grow.

S3-routed reads don't just add a fixed delay to every query. That delay compounds as the cluster grows, because more compute nodes competing for the same shared object storage multiplies the round-trips, the cache misses, and the tail-latency spread that local NVMe was built to avoid in the first place. This piece walks through why that's a structural fact of the architecture.
Start with the basic mechanics. Query execution in a columnar engine like this depends on pulling hot column segments into memory fast, and the smallest unit of work is a granule, usually 8,192 rows by default. Index analysis picks out only the blocks a query actually needs, and in a shared-nothing setup, those blocks come out of the OS page cache at somewhere around 50 to 100 GB per second, bound by memory bandwidth. That speed is bound by memory bandwidth. Nothing about disk enters the picture.
Object storage changes that equation entirely. It isn't a slower disk, it's a network hop, and network hops carry their own retry logic and queuing behavior that a local read never has to deal with. Systems like a major cloud object store and another provider's blob storage are large distributed systems in their own right, with failure modes documented in public engineering write-ups: rare spikes of 5, 10, even 15 seconds occur under load. Those are edge cases baked into what it means to share a distributed object store with everyone else hitting it at the same time. They're baked into what it means to share a distributed object store with everyone else hitting it at the same time.
The per-query cost of an S3 round-trip is not fixed overhead you can budget for; it is a draw from a distribution with a long, heavy tail, and every draw carries some chance of landing badly. It's a draw from a distribution with a long, heavy tail, and every draw carries some chance of landing badly. A single node reading cold from S3 has already swapped a memory-bandwidth-bound read for a network-latency-bound one, even before clusters enter the conversation. That's the seed of the whole problem. Growing the cluster is what waters it.
How SharedMergeTree separates compute from storage and where the latency enters
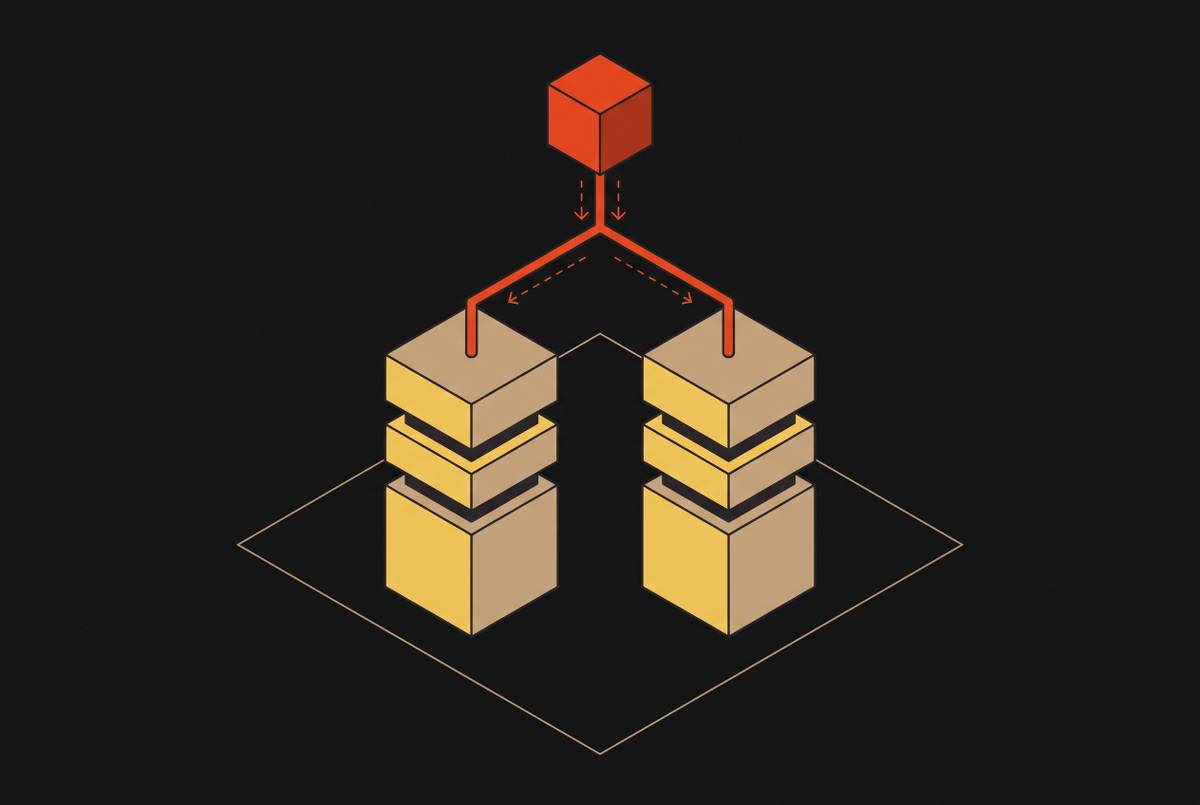
SharedMergeTree keeps data in shared object storage, S3 or GCS, so any compute node can read any data part without ever copying it between replicas. A new node joining the cluster syncs only metadata, coordinated through a Keeper service, with no data transfer involved. That's what makes horizontal scaling feel almost instant. Elasticity without shard rebalancing is a genuine architectural advance, not a marketing gloss.
The trade-off appears the moment a query runs. Read performance now hinges on whether the needed block sits in local SSD cache or has to be pulled from S3. A cache hit performs close to local disk. A cache miss means latency jumps straight from memory speed to S3 round-trip speed, and the documentation for this design states that cold queries carry higher latency than a self-hosted deployment running on local NVMe. That's a stated cost. It's a stated one.
S3 objects are immutable, which creates operational hazards around metadata consistency. If the local mapping between parts and their stored objects is lost, those objects can become unreadable orphans, sitting in the bucket with no map back to them. It's an operational hazard that comes bundled with the design, and it's something to plan around rather than discover during an incident.
SharedMergeTree is proprietary, available through the managed cloud offering and the enterprise edition, not shipped in the open-source release. So the latency profile described here is specific to that managed environment. It doesn't describe every self-managed deployment out there.
Why cache-miss exposure grows as more nodes compete for shared object storage
Without a shared caching layer, every node keeps its own independent local SSD cache. Picture a 10-node cluster where each node ends up caching the same hot partition separately. That's wasted disk space across the fleet, and it buys nothing in terms of a better hit rate for any node that just joined or just scaled up. Add a node, replace one, or restart one, and its cache starts from zero. Every query that node picks up next is a guaranteed trip to S3 until the cache has time to warm back up.
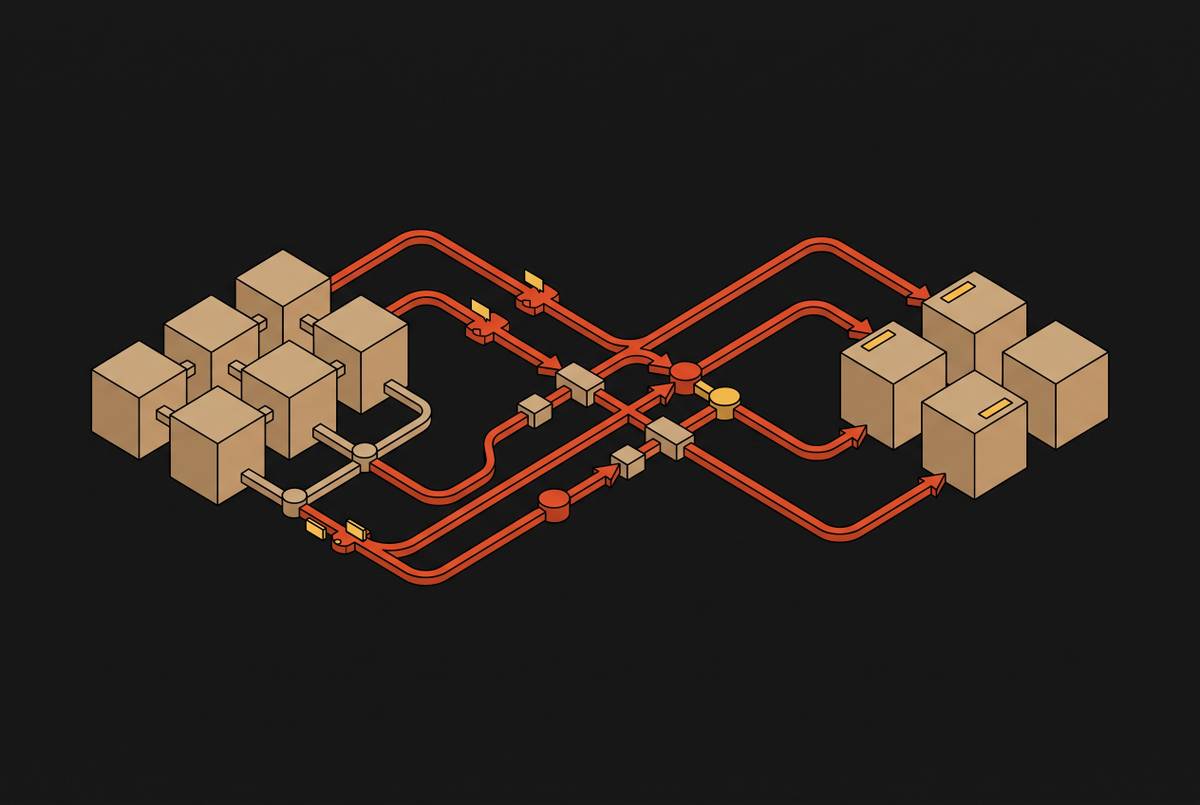
Follow the pattern and the problem gets obvious fast: more nodes means more independent cache states, and each one starts cold whenever a node joins, restarts, or scales up. Each miss is a fresh draw from that heavy-tailed S3 latency distribution described earlier, so more draws per second across the cluster raises how often tail events occur in the aggregate. Fixing this requires more than a config change since it's a structural property of caching independently across nodes. It's a structural property of caching independently across nodes, and it gets worse, not better, the more nodes get added.
The retry engineering built around this problem is itself a tell. Multiple connections, endpoint rotation, aggressive retry counts, one recent release raising the default retry attempts to 500, all of that exists because S3 tail latency is real enough to demand serious engineering time. None of it removes the tail. It manages the tail, which is a different thing entirely.
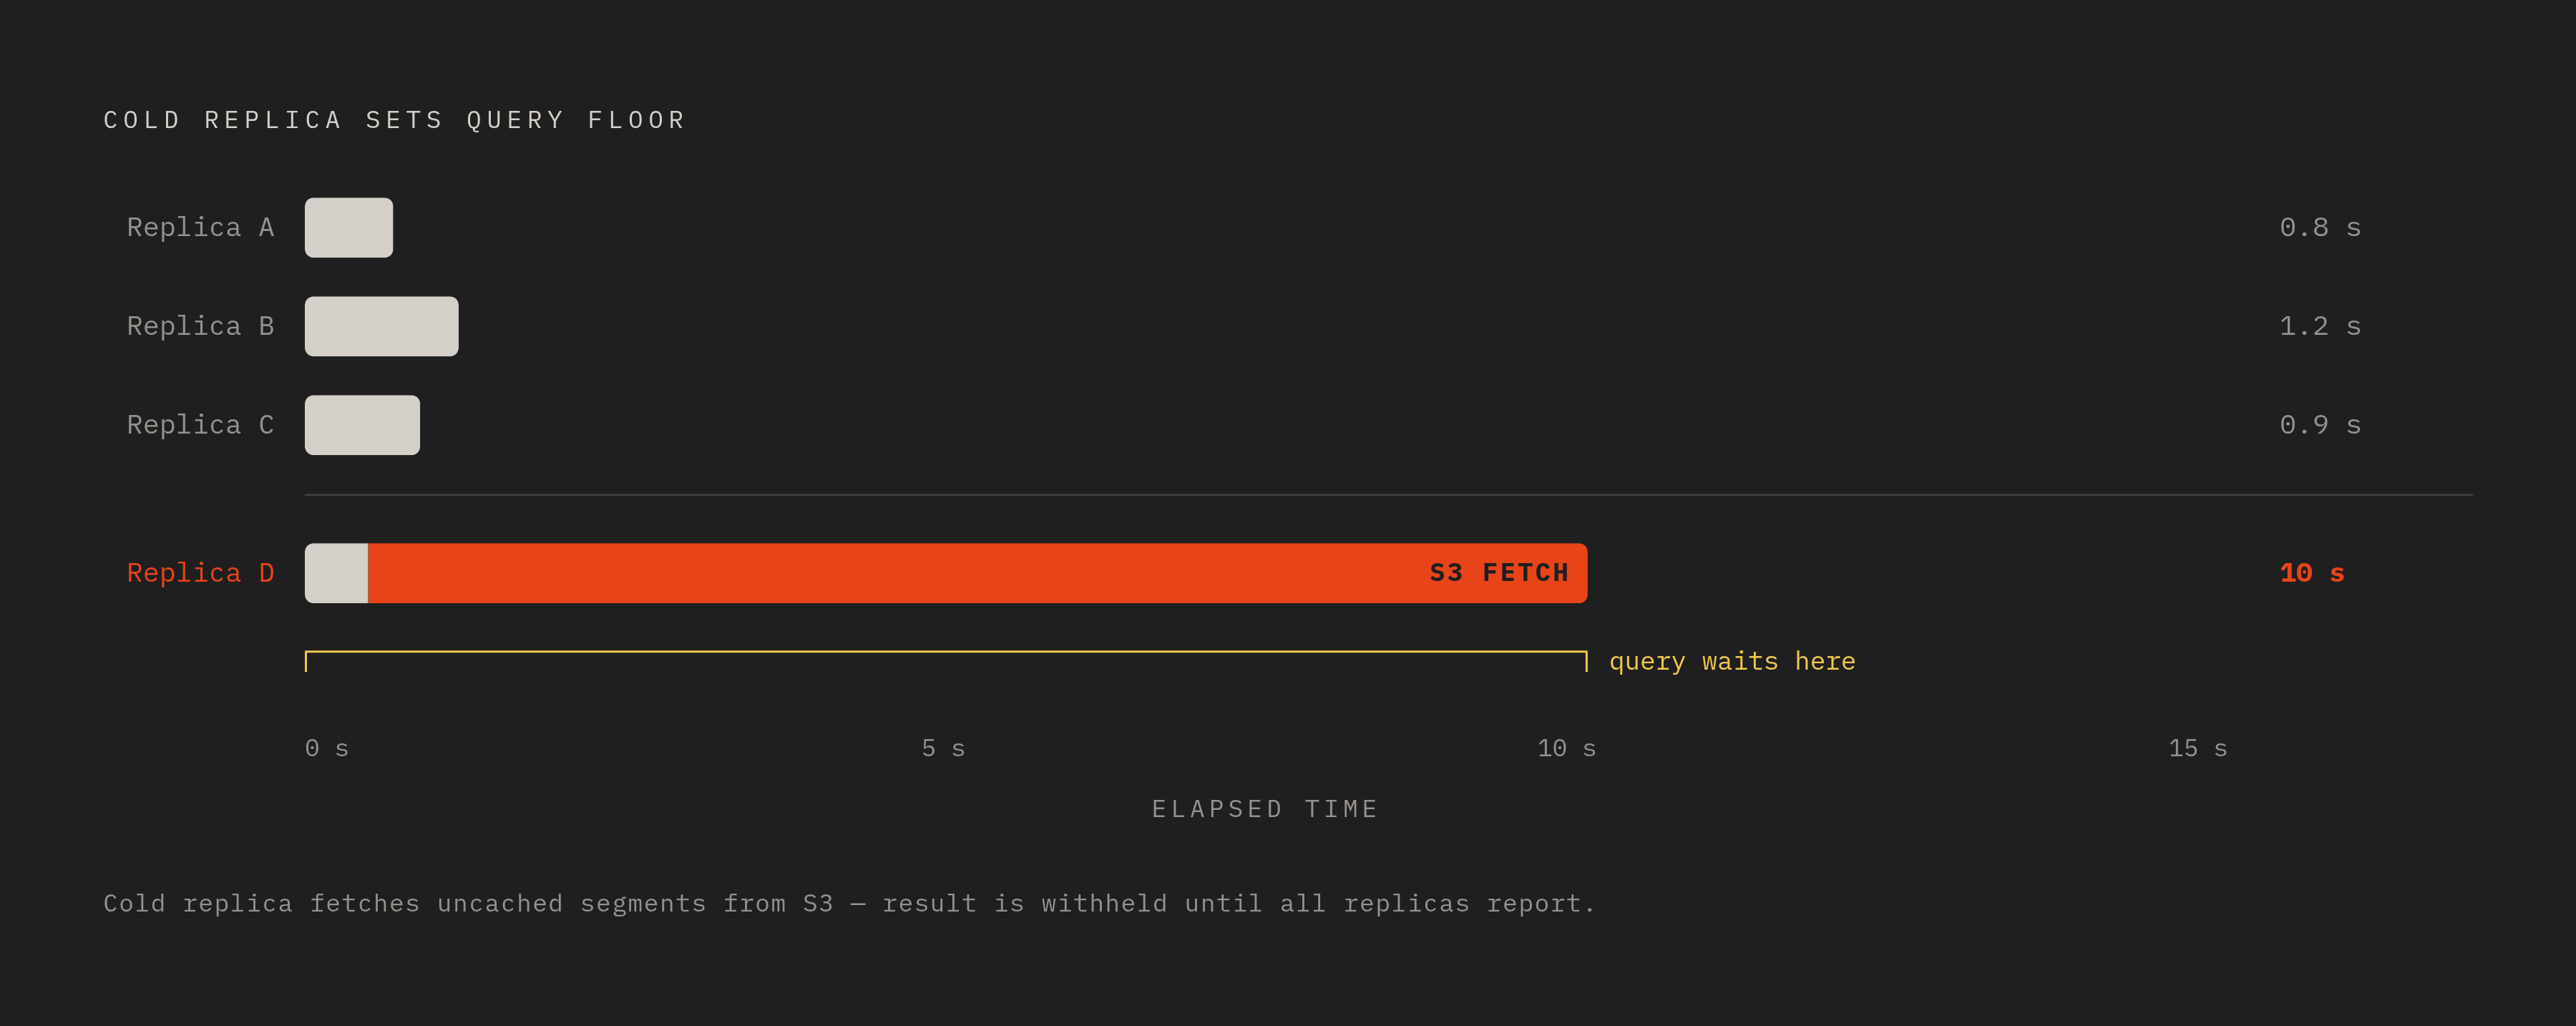
Parallel replicas make the exposure worse, not better, in one specific way. That feature splits a single query across multiple replicas, and the query's total latency is bounded by whichever replica finishes last. Filesystem cache state differs from replica to replica depending on what each one has handled recently, so a cache-cold replica can drag the entire query's p99 down with it, no matter how fast the warm replicas run.
Tail latency under parallel replicas: why the slowest node sets the query's floor
Splitting scan work across replicas and collecting the results centrally is correct in principle. In practice, it gets risky the moment cache state is uneven across the fleet, and random task assignment can hand real work to a cold replica while a warm one sits there doing nothing.
There's a real mitigation built in. The execution model uses a pull-based approach, sometimes called the announcements mechanism, where faster replicas can steal remaining work and slow or unavailable ones get excluded from the assignment. That genuinely helps. But it can't undo the first assignment. If the very first task lands on a cold replica, the damage to that query's tail latency happens before any stealing has a chance to kick in.
So under parallel replicas with uneven cache state across nodes, a single cold replica's S3 fetch, one of those 5-to-15-second spikes mentioned earlier, becomes the effective floor for the whole query. That's what happens, predictably, when independent cache states meet a shared-storage architecture running at scale. It's what happens, predictably, when independent cache states meet a shared-storage architecture running at scale.
Parallel replicas for Merge table types is listed as a gap on the public 2026 roadmap, so the feature doesn't yet extend to every table type. Some workloads can't reach for this mitigation at all, cold replica or not. The honest summary here: parallel replicas raise throughput and improve median latency. They do not flatten p99 once cache state starts to diverge across the cluster, and treating them as a full fix for tail latency oversells what they do.
Schema decisions that worsen S3 read amplification before a query even starts
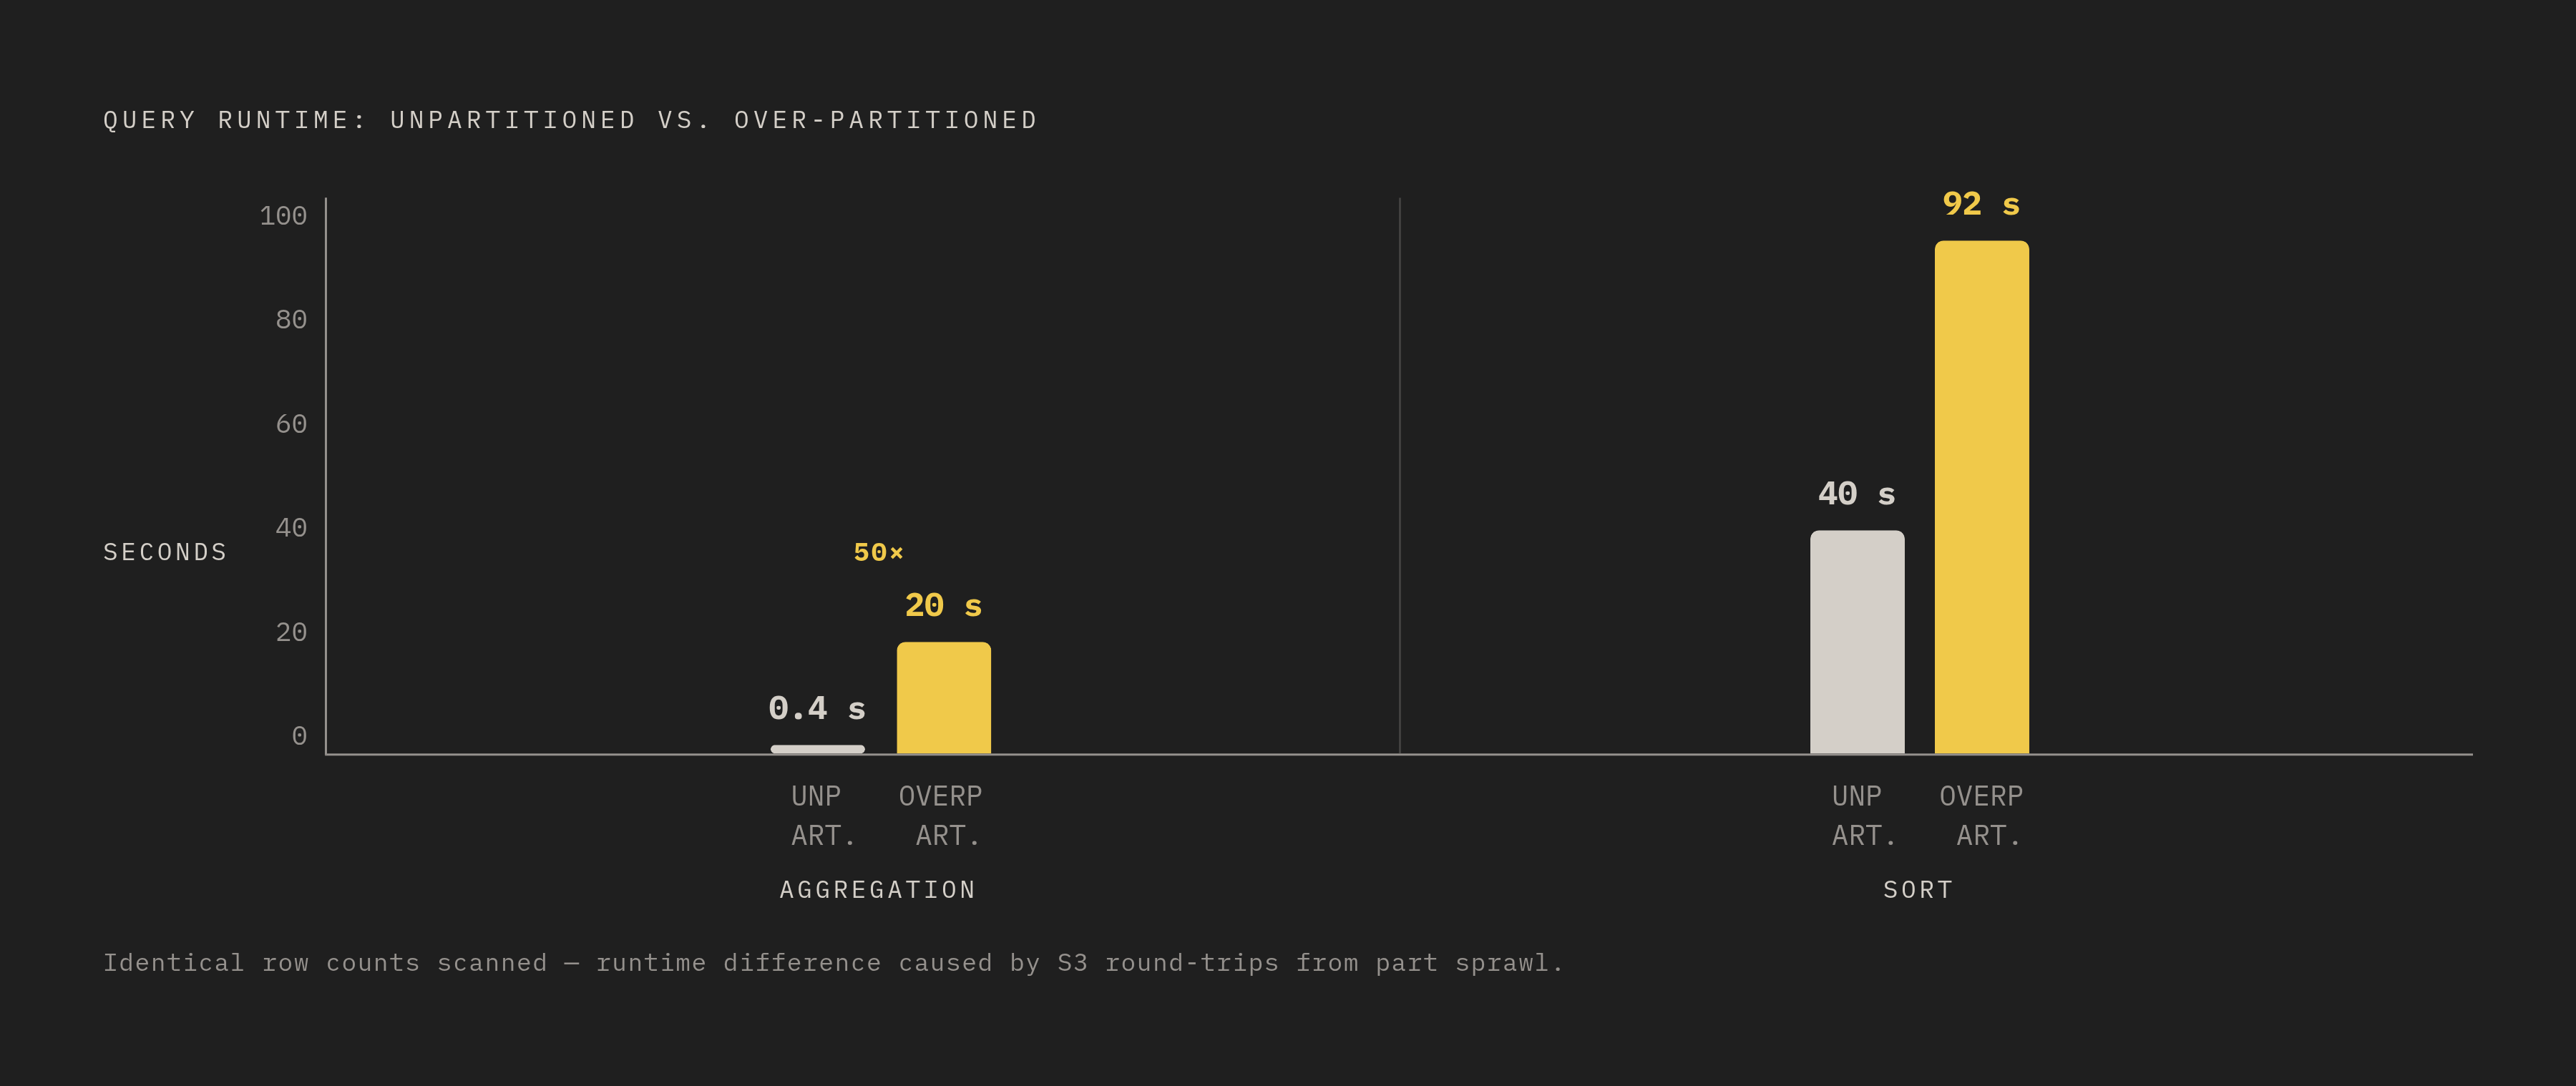
Over-partitioning is the single most common schema mistake that makes S3 reads worse than they need to be. Parts never merge across a partition boundary, so partitioning on something high-cardinality, a tenant ID, or daily buckets on a table with heavy volume, produces a sprawl of small parts. More parts means more distinct S3 objects to fetch per query, which means more round-trips, more surface area for a cache miss, and more chances to draw a bad tail-latency event.
The numbers here are stark. One benchmark ran a simple aggregation in 0.4 seconds against an unpartitioned table, and 20 seconds against a partitioned version of the same data, a slowdown of many times over despite scanning the identical row count. The partitioned table also used 55% more memory during load. A sort query on the same two setups told a similar story: 40 seconds unpartitioned against 92 seconds partitioned.
A large-scale production example backs this up. A petabyte-scale cluster running at Cloudflare hit a partitioning change that caused critical billing jobs to stall out. After a binary-search part-pruning patch shipped in March 2026, query durations dropped by half, and the tight correlation between part count and query duration broke apart. That's a real system, hitting a real wall, and getting fixed by addressing part count directly rather than tuning around it.
The ordering key matters just as much, maybe more. It decides physical row locality inside each part, and a well-chosen ordering key lets index pruning skip blocks before they're ever fetched. Every block skipped through primary key pruning is an S3 round-trip that simply never happens, which makes this the single highest-leverage schema decision available on an S3-backed cluster. Skip indexes are useful too, but only as a secondary tool: they only pay off when the indexed column correlates with the ordering key columns. Without that correlation, they add overhead and reduce nothing.
TTL policies deserve a mention as well. TTL expiration runs during background merges, not at insert time, and if partition boundaries don't line up with how TTL is structured, the system ends up doing expensive mutation-style rewrites instead of just dropping whole parts cleanly. That generates extra S3 write traffic that competes directly with the read traffic a query is trying to run at the same time.
ClickHouse's distributed cache: what it fixes and what it still leaves unresolved
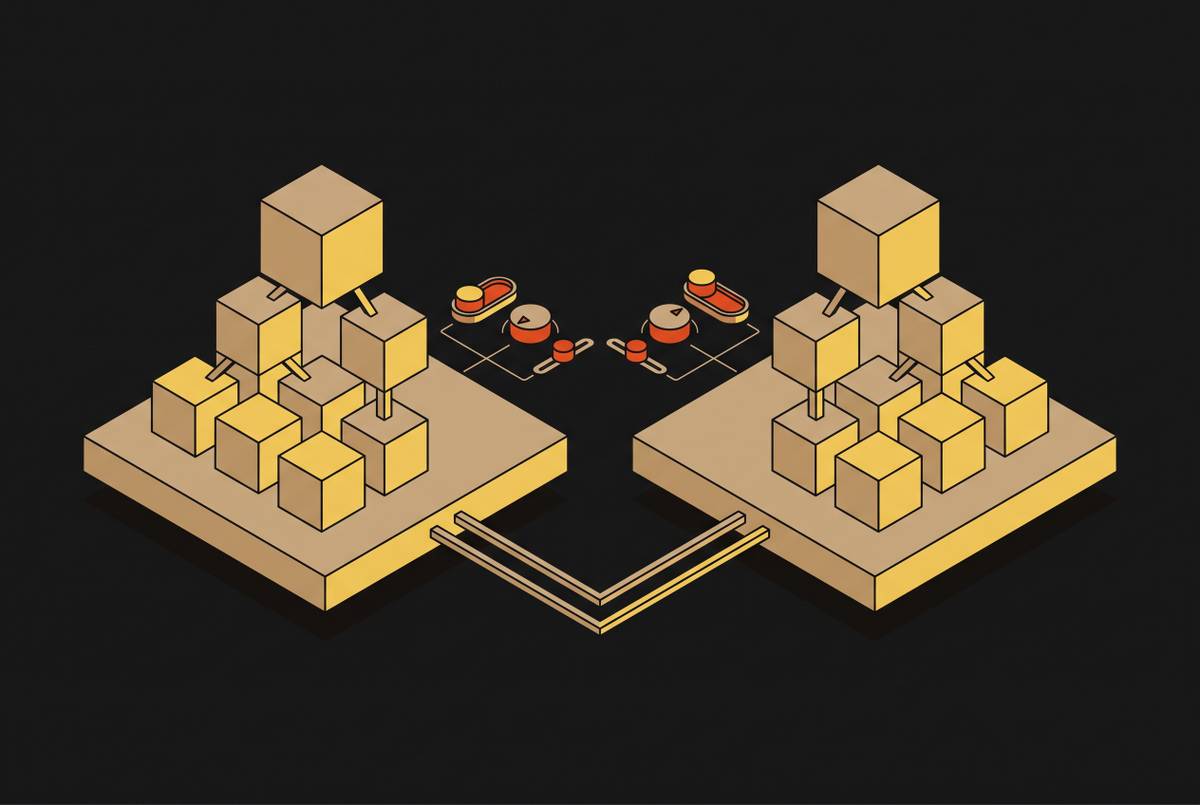
A distributed cache changes the underlying picture by making cache state shared across every compute node instead of local to each one. One node's cache miss populates a shared layer, and every node after that fetches the same block over a fast internal network rather than going back to S3. Compute nodes become stateless and diskless, and purpose-built cache nodes take over managing and serving the hot data. Because reads can pull from multiple cache nodes in parallel, the architecture allows for throughput that, at sufficient scale, starts to approach memory-bandwidth speeds again.
A July 2026 benchmark from the engineering team behind this feature measured a hot run at 0.7 seconds, 8 times faster than the hot-run baseline on local SSD, achieved by adding stateless compute nodes that share cache state instead of each keeping its own copy. That's a meaningful number, and it points at where this kind of architecture is headed.
Two caveats matter just as much as the number, though. First, the same source is explicit that the distributed cache is still in testing: not fully optimized, not fully scaled, and the benchmark result doesn't reflect final production performance as of that July 2026 date. It is not yet generally available. Second, it doesn't resolve everything on day one. Cold starts still go to S3: the very first query on a cold cluster gets no benefit until the shared cache has had time to warm.
There's also an alternative hot tier, S3 Express One Zone, which offers single-digit-millisecond first-byte latency. One benchmark showed a count() over a trillion-row Parquet dataset running several times faster on Express One Zone than on Standard S3. But Express pricing runs at $0.11 per GB-month, several times Standard pricing, and it layers on per-byte transfer charges, $0.0032 per GB up and $0.0006 per GB down, that hit on every merge rewrite. Price cuts in April 2025 dropped Express GET costs 85% to $0.00003 per thousand requests (13 times cheaper than Standard's $0.0004) and write-request costs 55% to $0.00113, but the byte-transfer charges on a merge-heavy workload can eat into those savings fast. The economics need real modeling before anyone assumes Express One Zone is the cheaper option by default.
Taken together, a shared distributed cache is a genuine step toward closing the compounding-miss gap described earlier in this piece. Until it reaches general availability and its production numbers are known, teams still need to design around the gap it leaves open today.
What a cache-mesh architecture eliminates and how to evaluate any managed service against it
The structural flaw here doesn't get fixed by tuning a retry count or adjusting a thread setting. It comes from routing every query through a remote, shared, contended object store that has tail latency built into its nature. No amount of configuration changes what that store fundamentally is.
The right architectural answer keeps hot data in memory, on fast local or network-local NVMe, and never sends a query out to S3 when the block it needs is already sitting in cache. Cache state gets shared across nodes, so adding compute never resets what's already been learned about which data is hot. That's what a cache-mesh design provides: hot data stays hot whether the cluster scales up or down, because the cache is a shared resource instead of something each node has to rebuild from scratch. Flat p99 latency as data grows into the hundreds of terabytes is a property that falls out of this design. It isn't a tuning trophy earned on top of S3-routed reads.
Agentic workloads make this urgent in a new way. AI agents probe databases constantly and in parallel, firing off many concurrent queries in the course of exploring a dataset, and on a naive S3-routed cluster, each one of those is its own independent cache-miss draw. Per-query pricing turns that curiosity straight into a cost line. A compute-hours pricing model, rather than one billed per query, means a workload with a lot of questions to ask, whether it's a dashboard refreshing constantly or an agent exploring a schema, never gets penalized just for asking more of them. Isolated, read-only compute running over shared data, paired with full query logging, is what makes that kind of access both fast and auditable at the same time.
Anyone evaluating a managed service running on this kind of architecture should ask a short set of pointed questions. Is hot data actually served from memory or NVMe, or does every query get routed through S3 regardless? Is cache state shared across compute nodes, or does adding a new one start out cold? What happens to p99 latency specifically as the cluster grows from 2 nodes to 10 to 20? Is the benchmark data reproducible against an identical workload, or is it a number picked to look good in a slide? And does the pricing model punish parallel or high-frequency query patterns, the exact kind of pattern agentic workloads produce?
Schema discipline still matters no matter which architecture the system runs on. Ordering keys that match actual query patterns, partition boundaries that line up with TTL time units, part counts kept inside a healthy range, all of that reduces how much S3 gets touched regardless of what's running underneath. It's a mitigation layered on top of a structural problem that still needs solving at the storage layer itself.
The right way to judge a managed service compatible with one popular analytical database comes down to one plain standard: it should run faster and cost less than something self-hosted, not charge a latency tax in exchange for convenience. That standard is only met when the architecture itself takes the S3 round-trip out of the hot path a query actually runs on.