How to Replay Production Query Logs Against a Candidate Cluster
Test whether a database change survives real production traffic.
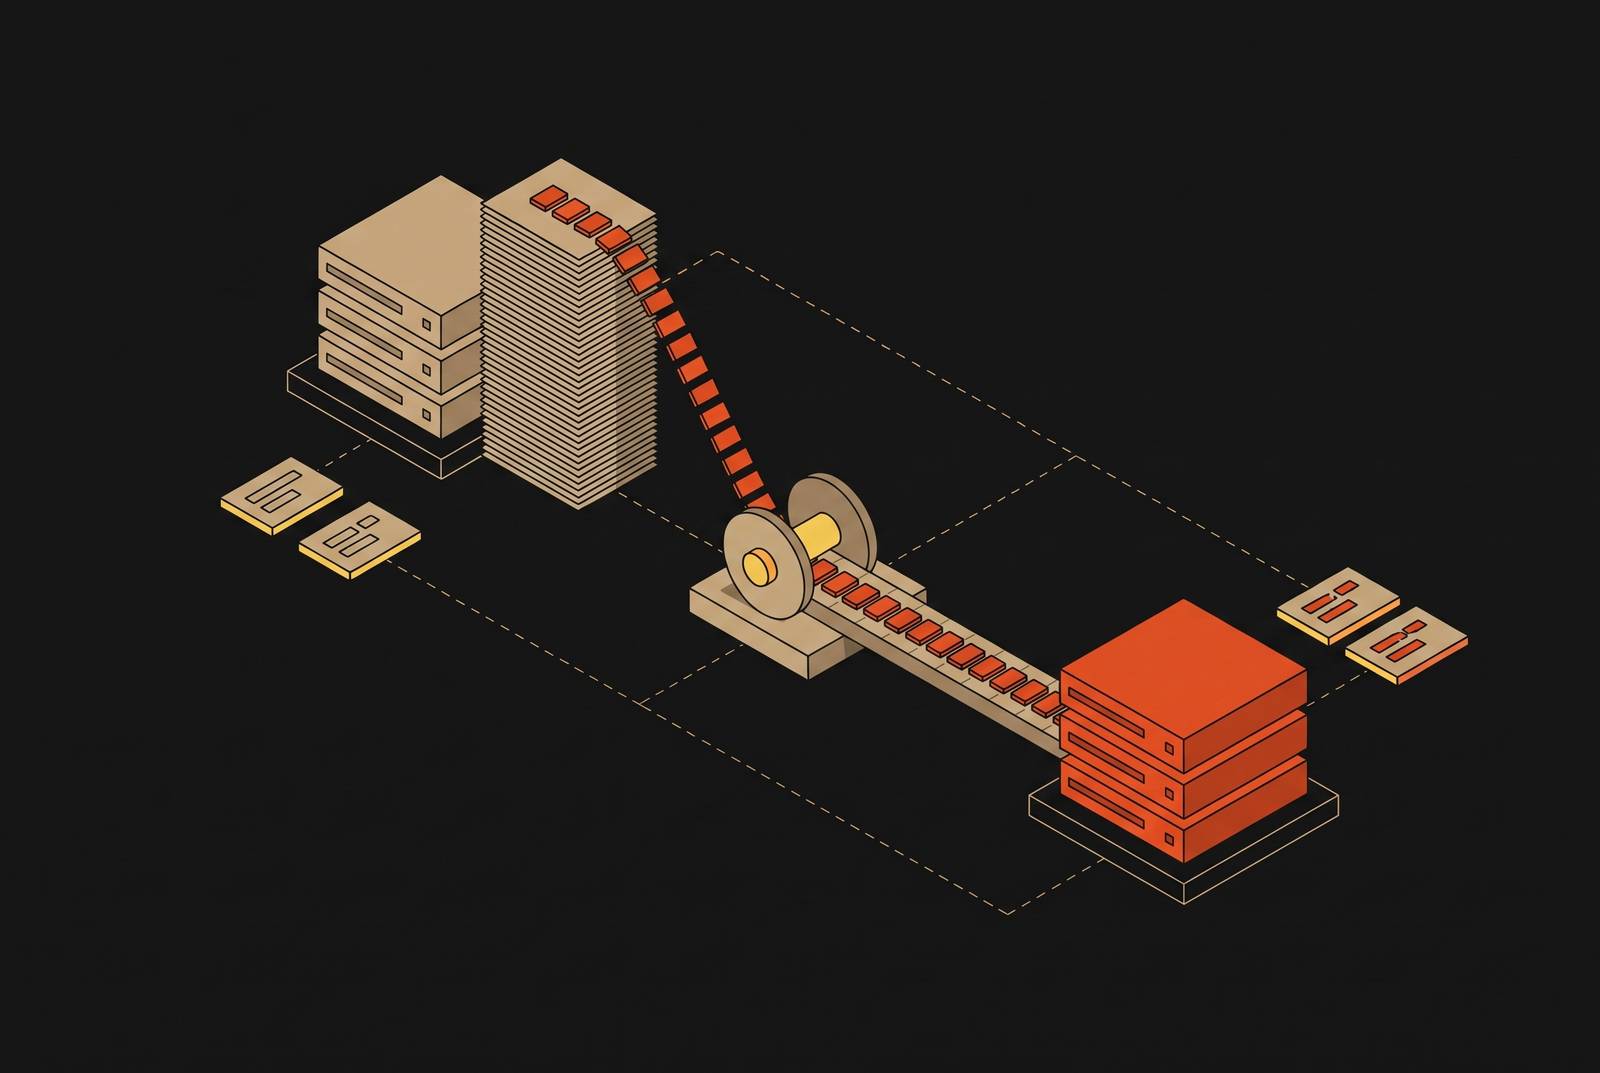
Replaying production query logs against a candidate cluster tests whether a change can handle the workload it will get. The answer depends on more than running captured SQL. A trustworthy replay preserves transaction context and timing, protects production data, and compares results against a matching baseline. Each stage can otherwise turn a real regression into noise, or make an unsafe candidate look ready.
Why synthetic benchmarks fail to surface the failures that matter
Synthetic benchmarks test the workload a team imagined. Engine upgrades, schema migrations, and hardware re-sizing face a less orderly test in production, where real cardinalities, concurrent sessions, and transaction interleaving expose incompatibilities that a designed workload may omit. Airbnb named subtle behavioral differences between MySQL 5.7 and 8.0 as a motivation for building capture and replay. These are failures that can break applications even when a benchmark reports acceptable throughput.
Correctness also sits outside a throughput test’s view. A query can finish just as quickly on the candidate yet return a different row set or row count. A latency histogram cannot reveal that difference. If synthetic tests cannot expose failures rooted in the actual query distribution, the only way to know is to run the real traffic.
The three decisions that determine whether a replay is faithful or misleading
The capture point determines which context survives into the replay. Client-side logging can fit an application’s language, but separate Java, Python, and Ruby frameworks need upkeep and leave it unclear who owns them. Airbnb’s legacy pipeline also failed to keep the full transaction context. Its replacement captured through ProxySQL, which was already on the traffic path, so the application languages had a shared capture point with wire-level context. Service-level sidecars offer another path, while tcpdump or slow query logs can suit simpler stacks but lose transaction context in multi-service architectures.
Transaction reconstruction is a separate decision from capture. Firing the right queries across the wrong transaction boundaries changes write-write interleavings and read-after-write dependencies. Airbnb’s Log Processor therefore decoded logs, grouped queries by database cluster, and reconstructed transactions before preparing traffic for replay. Fidelity still involves trade-offs. Retaining production auto-increment IDs keeps dependent queries comparable, but stops the test from exercising the candidate’s own ID generation. Likewise, result comparison must allow for the fact that queries without explicit ORDER BY can return rows in any order.
Timing determines what kind of load the candidate experiences. Sending everything as fast as possible tests a burst, changing the original concurrency pattern. The original pgreplay illustrated a different distortion, where a slow query stalled subsequent traffic and created artificial idle periods. The pgreplay-go implementation instead modeled connections independently, so a slow query blocked only its own connection. The choice depends on the stack, but it cannot remain implicit.
Extracting a faithful log snapshot from a production cluster
Treat the capture as production data from the outset. Query literals can hold personal information, so safeguards must be in place before the first log is written. Airbnb encrypted captured logs in transit and at rest, gave only the database infrastructure team access under least privilege, and ran replay only in production-equivalent environments. It did not copy traffic into a development tier. Sanitization later in the pipeline does not replace these controls.
Choose a bounded window that represents the intended test. An off-peak sample underrepresents concurrent writes, while a batch-job window can overrepresent bulk operations. Percona recommends setting long_query_time=0 during a peak capture window so the slow query log records all queries, then limiting logging to that window. Proxy-layer capture needs no application changes, but should likewise be enabled only for the selected cluster and duration. Capture is not permission to replay in place. Percona explicitly warns against running Playback on the production server because it executes both SELECT and DML queries.
Kubernetes sidecar capture is one optional variant. Speedscale shows a deployment annotation triggering a rollout that restarts the connection pool. For PostgreSQL with HikariCP, seeing connections open is necessary because statements are prepared once per connection, and capture must include the prepare, bind, and execute sequence. Plan that restart as part of capture. Once recording starts, move logs off the host as soon as possible. Airbnb used a Log Mover sidecar to ship logs continuously to object storage before offline processing, avoiding local disk accumulation. Speedscale’s time-range selection gives capture another clear boundary by saving a named snapshot, so a loose collection of files no longer defines the test.
Sanitizing the log before it leaves the capture environment
A raw log is not yet a replay artifact. Mask or anonymize personal data in literal parameters, including names, emails, and payment tokens, before the log leaves the production-equivalent capture environment. Normalization must also address comparison hazards. Airbnb rewrote inserts to retain production auto-increment IDs so later queries depending on last_insert_id would not diverge. Mark unordered results as non-deterministic before diffing them, rather than counting a change in row sequence as a failure.
Check the candidate’s starting data before handing over the log. Percona recommends a replica or an xtrabackup copy taken just before capture to align the dataset with the recorded traffic. The privacy boundary above requires that copy to stay in a production-equivalent test environment and out of an ordinary development tier. Restore it after any replay that executes DML. Otherwise, the next run starts from changed data and can produce misleading row-count or constraint failures.
If the migration deliberately removes a column, failures from queries that reference it are evidence the test should preserve. Speedscale demonstrated this when dropping a column caused the INSERT and SELECT statements touching it to fail. Inspect the snapshot’s Database schema view before replay to see which tables and statements it exercises. That inspection establishes what the capture can actually validate.
Choosing between load-only replay and compare-and-diff replay
What must the team know before cutting traffic over? If the question is whether the candidate can handle more traffic, choose load-only replay. It sends queries to one target and tracks errors, latency per query digest, and the resources used, but does not compare results. A configurable speed factor makes this useful for capacity planning and hardware re-sizing. Airbnb used accelerated replay before peak travel season to test future load on the configurations it already had.
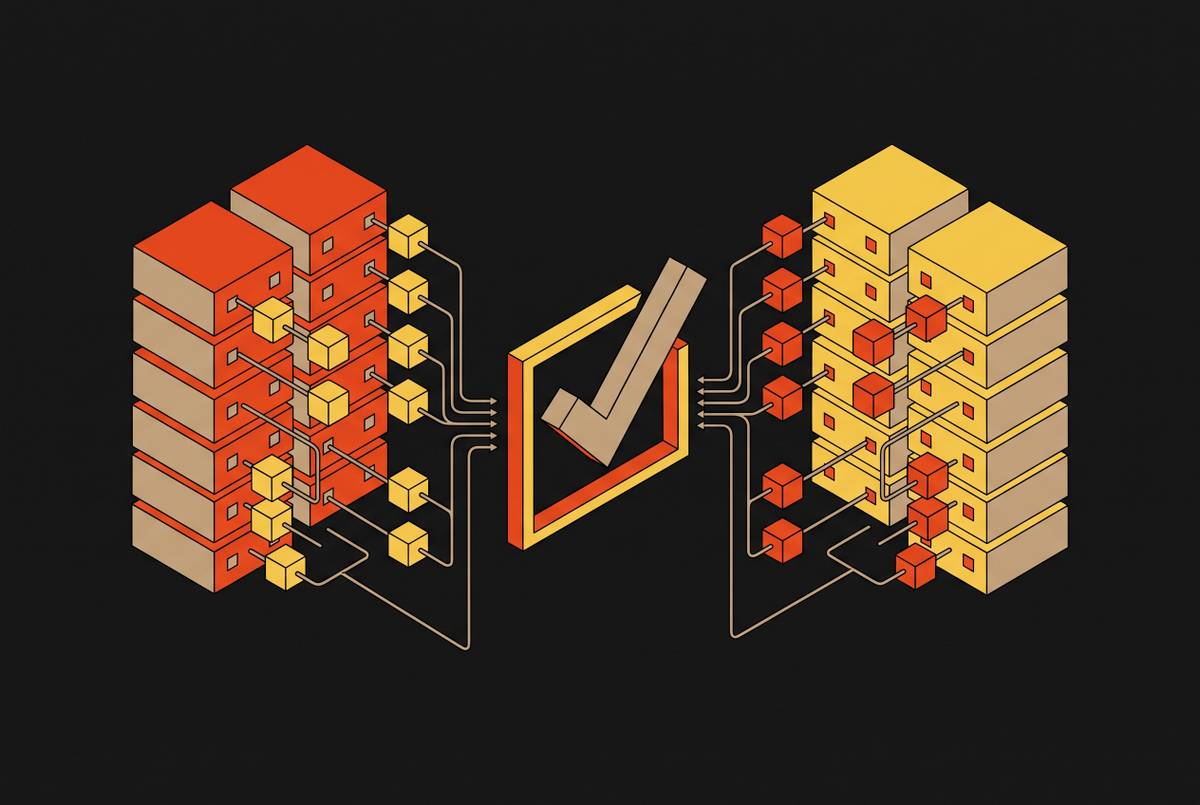
If the question is whether the candidate behaves the same, choose compare-and-diff. This mode runs the same queries against two targets simultaneously and records differences in their results. Both must start from the same data snapshot. It works well for engine upgrades, schema migrations, and moves to another managed service, where queries can run fast even if the targets differ in behavior.
The modes can also form a sequence. Some teams first use load-only replay to establish that a candidate is not severely under-provisioned, then compare results at a 1× speed factor, treating capacity and compatibility as separate requirements that both need to be met. The selected mode determines which evidence the run must collect and what constitutes a failure.
Running the replay with timing fidelity and controlled concurrency
Begin execution from the aligned, restored data snapshot. The same schema is not enough if the rows differ from those at capture time. Prepare the buffer pool as well. Percona warns about cold-buffer effects and says its example skipped a warm-up read pass. Running that pass before measurement avoids attributing early page-loading latency to the engine or schema change under test.
Map each logical connection to an independent replay worker. The pgreplay-go implementation uses a goroutine per connection so unrelated traffic can continue when one query slows down. Keep the captured transaction boundaries within those connections so the log’s statements stay in their transactions. Concurrency is an explicit execution setting. Speedscale shows recorded statements running with 10 concurrent sessions, so the session count is chosen explicitly as part of the test.
At 1×, query spacing follows the original timing, while 2× or 3× accelerates the workload to model growth without replacing its relative shape with an immediate burst. Airbnb’s workers poll a message queue, get the log file assigned to them from object storage, and wait until the task is due to start. They then space queries according to original timestamps and the selected factor. Five-minute buckets per cluster and ProxySQL pod give scheduling fine-grained control, allowing workers to start at staggered times.
Gather evidence while those workers run as well as afterward. Connection refusals, syntax errors, and constraint violations can be the first visible signals that something is wrong. Record latency by query digest, which groups normalized query forms so queries whose literals differ are treated as part of the same group. Track candidate CPU, memory, and I/O during the replay window against the production baseline. In compare-and-diff mode, retain each result discrepancy with the full query text so investigation does not require another run merely to identify the failing statement.
Interpreting latency divergence and error output after the replay
First ask whether the increase occurs mainly at the beginning, when a cold buffer pool can dominate response time. Then inspect latency by digest alongside the aggregate p99. An increase in a few digests points to a changed execution plan or an index difference, while an increase across many digests suggests hardware or configuration. Airbnb’s MySQL 5.7-to-8.0 replay exposed a single query with a dramatic latency increase, illustrating why the distribution needs that closer view.
A sharp rise in commit latency when writes are pushed well above baseline indicates a resource limit, with any regression in one query still uncertain. Errors also need classification before they become migration verdicts. Unknown-column and missing-table errors show which schema elements the application depends on that differ between the targets. The decision is whether the application can tolerate those differences. Constraint violations absent from production instead point toward data-state divergence, including a dataset that was not restored between runs.
Result discrepancies require the same discipline about the baseline. A row-count mismatch can reflect changed behavior, but it can also come from data drift. Percona identifies mismatched data as a typical cause of playback errors. Check that distinction before treating the mismatch as a regression, and triage row-order differences from queries without ORDER BY before counting them as failures. Once those artifacts are excluded, differing results with unchanged latency are especially consequential because load-only replay would have missed them entirely.
The findings should lead to a specific next test. A regressed digest may identify an index to add, a query to rewrite, or an execution plan hint to apply, offering a way to continue the migration with targeted fixes. After a fix, restore the candidate dataset and replay the same snapshot with comparable warm-up conditions. A different starting state undermines the comparison. If the candidate passes at 1× without latency or result divergence, run at a higher factor to establish room for growth before declaring it ready.
How agentic query workloads change the replay picture
A faithful replay can still represent the wrong future. Human-facing applications tend toward point lookups and narrow selects, while agents issue broader scans, schema-probing queries, and multi-step dependent queries. Those patterns behave differently under concurrency. Agents also connect through direct SQL tools, text-to-SQL, pre-indexed retrieval, and protocol-based connections, each producing different query shapes. Increasing the speed of an OLTP point-lookup corpus does not add patterns that the capture never contained.
For teams preparing for agent traffic, the lesson is to supplement production capture with representative agent query traces. At minimum, identify which expected patterns are underrepresented in the current corpus. Auditability becomes part of the test as well. Preserve full query logs during production operation and replay so an incident can be reconstructed, with the production-data protections already established. Without that record, the run cannot explain what the agent did.
Isolated, read-only compute, full query logging, and sandboxed branches for tests against real data each have a place in the replay process. Sandboxed branches let agents or replay workers use real data without touching production, while logs keep the evidence for review later. The candidate must pass the captured workload, and that workload must contain the queries it is being prepared to serve.