What Merge Tree Part Count Does to Read Latency at Scale
Thousands of small parts slow reads far more than the data volume itself.
MergeTree read latency is often a problem of part count. As tables grow, the work of opening and checking thousands of parts can outweigh the work of reading useful rows. This article explains why that happens, how to recognize it, and why schema and ingestion changes address the cause in ways that extra hardware or query tuning cannot.
Why part count — not data volume — governs read latency in MergeTree tables
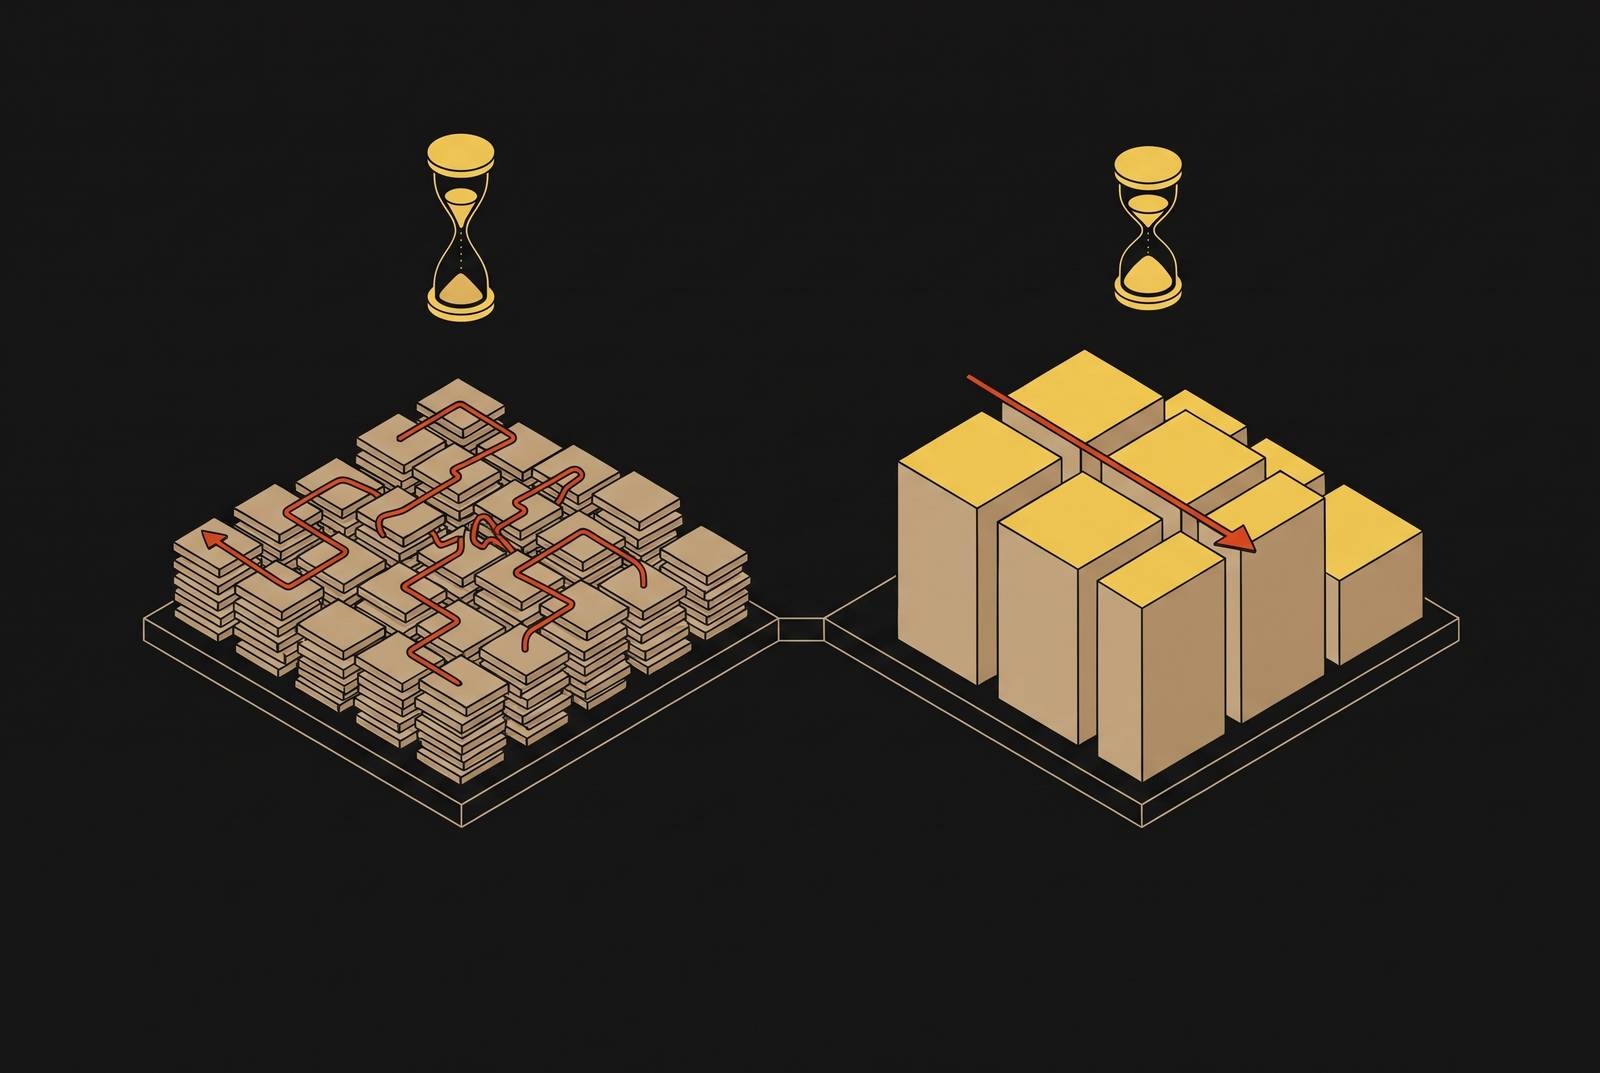
The same data on the same hardware can produce very different query times depending on how many parts hold it. A table with billions of rows in a handful of well-merged parts can answer a range query faster than a much smaller table scattered across thousands. For each part touched, the engine opens metadata, examines index entries, and checks whether any granule satisfies the query’s predicates. Even a part that contributes no rows can incur this work.
Inserts create immutable parts, stored as directories on disk. Background merges consolidate them, while mutations and lightweight-delete masks change data through new part versions. The parts present at query time therefore reflect both the arrival pattern and the progress of background work.
Range-query time goes into three main tasks: opening parts, checking their indexes, and scanning rows. The first two grow with parts touched. Even with the same row count, more parts mean more of that repeated work. The sparse primary index can eliminate large amounts of scanning, but the engine must first interrogate the relevant parts’ indexes to find what it can skip. With many small parts, that discovery work can become the dominant expense.
How background merging is supposed to keep part count bounded, and why it falls behind
Background merging is meant to prevent this accumulation. It folds small parts into progressively larger ones, reducing the number of separate objects the read path must handle. Under a manageable insert pattern, the merge process keeps part count bounded while rows continue to arrive. Table growth need not mean steadily worsening fragmentation.
The difficulty is that creation and consolidation face different limits. Merging consumes a bounded pool of CPU threads and disk throughput, while clients can create parts by opening connections and submitting inserts. A fixed merge pool can absorb a moderate stream of small writes, but sustained creation above its consolidation rate leaves it chasing a growing backlog. More rows are not necessarily the problem. Too many new parts per unit time are.
The engine has safety valves for this imbalance. parts_to_delay_insert starts throttling writes, parts_to_throw_insert rejects them with a “Too many parts” exception, and max_parts_in_total limits parts across all partitions of a table. Older documentation may refer to an earlier default for the throw threshold. That history helps explain familiar errors, but an error threshold is not a performance target. Read slowdowns become measurable when counts run well into the thousands, and waiting for rejected writes can leave a table operating poorly long before its protection activates.
The insert patterns that break the merge budget and produce runaway part counts
Inserts that arrive often in small batches are the most common cause of too many parts. Sending rows as individual statements creates a stream of separate parts, while batching those rows can collapse that stream into far fewer parts. The data itself has not changed at all. What changes is the amount of consolidation required before the engine can read it efficiently. This makes part accumulation primarily an ingestion-pattern problem rather than evidence that the dataset has outgrown the hardware.
Over-partitioning compounds the pressure because each partition maintains its own parts. Hourly partitioning creates hundreds of times as many partitions per year as monthly partitioning, so merge work is spread across many separate groups. Small inserts and fine partitions can therefore reinforce one another. The practical rule is to keep the number of active partitions small. Daily partitions are often too fine for tables with a lot of data, and hourly partitions are almost always too fine.
But what if the source genuinely cannot batch? The architecture of Kafka consumer groups can limit their ability to batch when they provide exactly-once delivery across many small partitions. That shifts buffering responsibility to the database. Async inserts can coalesce incoming rows before they become disk parts. It is less clear how to choose between tuned async inserts and a staging layer, such as a Buffer table or external queue. As of October 2026, no published benchmark definitively resolves which performs better under sustained high-event-rate workloads.
What EXPLAIN indexes = 1 actually shows and how to read part-count pressure in a running table
EXPLAIN indexes = 1 shows which parts and granules a query selects, making it a useful starting point for diagnosing part-count pressure. Its value is not just the final amount of data selected. Comparing the candidate parts with the surviving granules shows how much filtering the engine does to find how little data to read. When only a small share of a large total is selected, the engine may have done a lot of part-discovery work.
If a query touches many parts but reads few granules from each, row scanning is not the obvious bottleneck. The engine does the work of finding small pieces of useful data across many separate parts. A selective predicate can make that contrast sharper. It reduces the scan without removing the repeated metadata and index work, so better pruning alone may leave much of the latency intact.
A query of system.parts that shows how rows are spread across active parts reveals whether the data sits in many tiny pieces or fewer large ones. Very few rows per part show that parts have been poorly consolidated, while high counts show better part quality. For ReplicatedMergeTree, replication lag supplies a related operational signal because a saturated merge pool can accompany a lengthening replication queue. Together, these observations help distinguish scan-heavy queries from fragmentation before a team evaluates a schema or ingestion change.
Schema and ingestion changes that keep part count from compounding as tables scale
The durable response is to change how parts are created and how readily they can consolidate. At the schema level, partition granularity has direct leverage because merges consolidate parts within partitions. Month or week partitions give that process more room than day or hour partitions. The choice shapes the table’s future behavior. A partition scheme that continually divides arriving data into small groups preserves merge pressure as the table grows.
Sort key design addresses a different term in the cost. A well-chosen ORDER BY lets the engine prune large portions of each part at the granule level, reducing rows scanned. That is useful even when part count is elevated, but it does not eliminate the work of checking many separate indexes. Sort-key pruning should be treated as a complement to part-count control.
On the ingestion side, the recommended goal is the fewest possible new parts per unit time. Aggressive batching reduces the work handed to the merge pool, and server-side async inserts provide buffering when source-side batching is impossible. By contrast, raising parts_to_throw_insert just lets the backlog grow larger before writes fail. The correct response to a “Too many parts” error is to fix insert batching rather than relax the safeguard and allow query performance to deteriorate further.
How part count interacts with object-storage-backed architectures to compound both latency and cost
Part-count overhead costs more when reads go through object storage. In that architecture, each part touched needs its own set of object-storage API calls, so the engine makes network round trips as well as doing metadata and index work. The same fragmentation now affects two budgets. It raises query latency and the bill for storage API requests, even when little useful data is read.
The contrast with local NVMe explains the compounding. Opening a hundred parts locally incurs overhead, but opening those parts through object storage places the repeated work on network timescales. A query that prunes almost everything may still pay for the remote calls needed to discover that result. Low scan volume is therefore not enough to establish that a query is cheap. The location of the per-part work changes its cost.
Keeping hot data in memory or a local NVMe cache breaks the remote-access component of that pattern. Cache hits reduce the cost of fragmentation by providing local access latency in place of object-storage latency, though the engine still has multiple parts to check. SharedMergeTree is relevant here because it decouples storage from compute in managed deployments, changing which portions of the work are paid locally and which remotely. Knowing which work is local and which is remote helps explain why similar part counts can lead to different latency and cost across deployments.
How AI agents querying MergeTree tables amplify part-count overhead across every step of their reasoning loop
An agent task often includes much more than one analytical query. Agents may call list_tables and DESCRIBE to discover schema, then use EXPLAIN ESTIMATE before executing SQL. CHKit’s structured commands for schema discovery and validation fit this preparatory pattern. These steps serve different purposes, however. Schema discovery differs from scanning table parts, while planning and data-access probes bring out the repeated work that comes with fragmented tables.
A human dashboard may tolerate one slow query during a session, but an agent can issue many probes in sequence as it develops and validates a query. Whenever those probes check parts, they repeat the overhead before the final answer arrives. The part-count budget for agentic access is tighter because the task can accumulate delays across its reasoning loop.
The MCP server implements MCP 2026-07-28, whose stateless protocol core removes sessions and the initialize handshake. With structured, versioned access, agent query storms and probe floods become problems to watch for in production. Accountability requires the whole task’s query history. Logging every query an agent issues, including preparatory probes rather than only final SQL, makes it possible to identify which tasks generate part-count pressure. Without that record, a slow final response can conceal the earlier probes responsible for much of its elapsed time.
Part count's effect on replication lag, ALTER operations, and recovery windows in production ReplicatedMergeTree deployments
In ReplicatedMergeTree, too many parts also mean more work beyond the local read path. Merge decisions require coordination through Keeper/ZooKeeper, so a heavily fragmented table accumulates coordination state as well as disk objects. That state can make ALTER operations slow or problematic. A schema change that completes in seconds on a well-merged table can block or fail on a part-saturated one.
The replication queue exposes another consequence of the same imbalance. When the merge pool is saturated, the queue lengthens and replica lag becomes an operational symptom. To catch up, replicas must work through the backlog. When a table is already struggling with part creation, a disruption is more likely to leave replicas behind incoming changes for longer.
A backfill, pipeline retry, or traffic spike can temporarily flood the system with new parts, while a merge pool sized only for normal arrivals has no spare capacity for that burst. The recovery window then depends on clearing the part backlog as well as bringing the insert rate back to normal. For teams responsible for uptime, part-count management is therefore a prerequisite for reliable recovery. The same ingestion and schema choices that spare reads thousands of small checks also keep merge and coordination work from obstructing the return to normal operation.