How to Size NVMe Cache for a Hot-Data Workload Before Migration Day
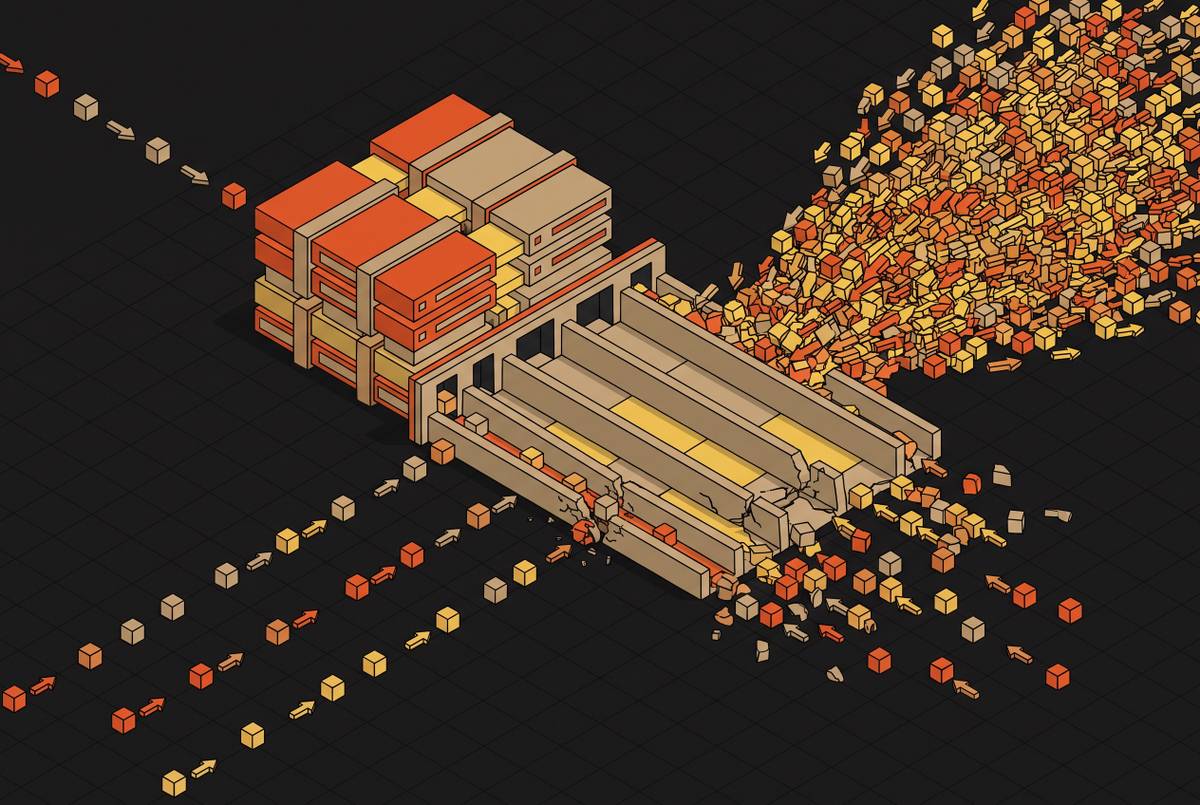
Undersizing NVMe cache before migration locks hot queries into S3's latency penalty permanently.
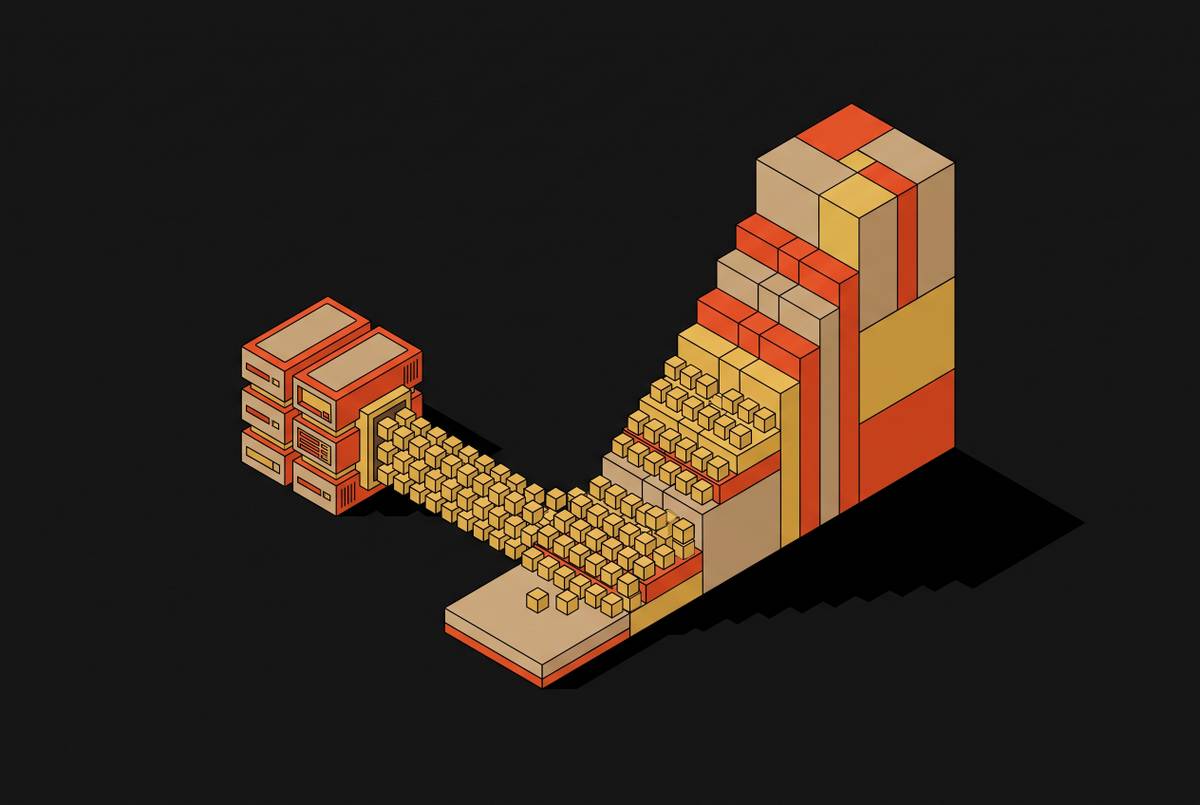
Undersized NVMe cache before migration day causes hot queries to fall through to S3, landing on the wrong side of a 15× latency gap that no post-migration tuning can close without adding hardware. No amount of tuning after migration day closes that gap without buying more hardware. M|The ClickHouse storage benchmark (oneuptime.com) shows NVMe delivering significantly lower query latency at far higher throughput than S3, on the same query pattern against the same data.
The two tiers aren't built for the same job. S3 is priced and engineered for durability and capacity at scale, not for the low-latency random reads that analytical queries against hot data demand. Intra-zone network latency inside AWS can run very low, but S3 tail latency can stretch into hundreds of milliseconds, and that spread turns a cache miss into something a customer actually feels.
Part of why NVMe wins so decisively comes down to how ClickHouse writes data in the first place. It stores column-oriented, immutable parts sequentially on disk, a design that minimizes random I/O and lines up well with how modern SSDs are built to perform. F|NVMe is a faster drive matched structurally to that access pattern. It's matched to that pattern structurally.
K|That match is why sizing has to happen before migration. B|Every byte of hot data that doesn't fit into the NVMe tier at cutover starts its life on the wrong tier, and the latency cliff appears immediately at the first query that misses. There's no grace period where a slightly-too-small cache quietly gets away with it. The cliff is there from the first query that misses.
E|How ClickHouse's two-level memory hierarchy changes what "cache size" means
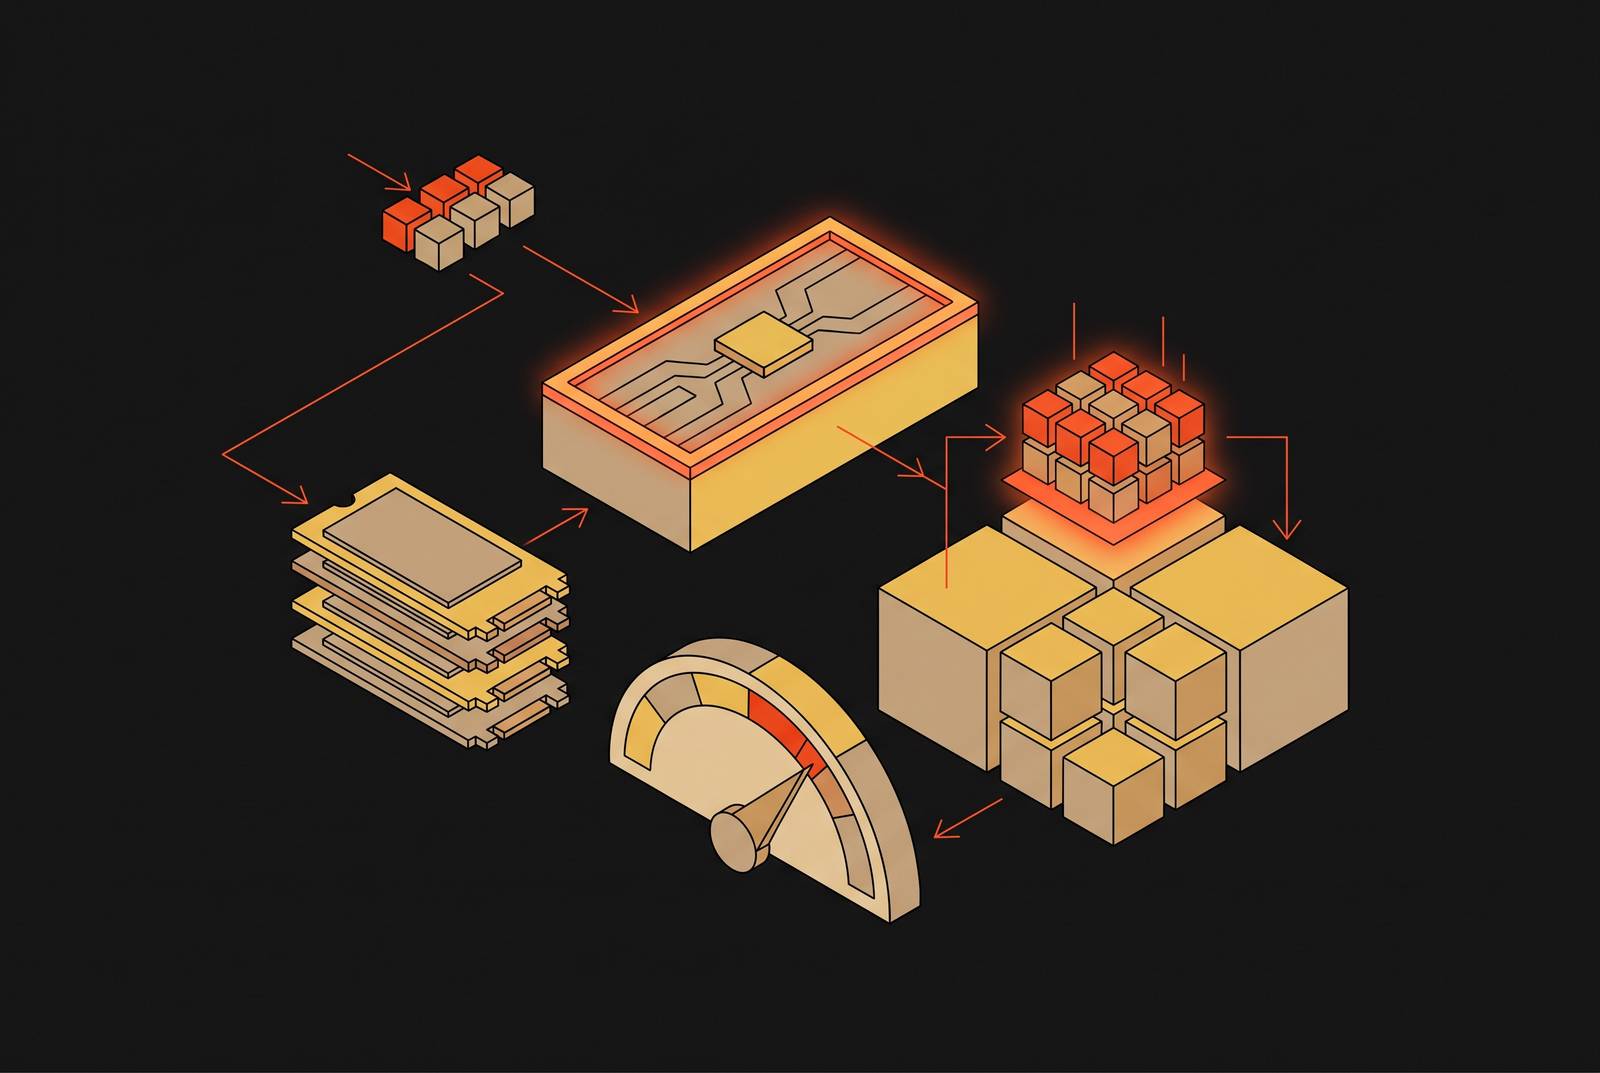
ClickHouse leans on two layers at once, OS page cache in RAM and physical NVMe disk, and sizing "the cache" as a single number ignores that split entirely. Get the split wrong and the resulting figure is wrong before it's even applied.
RAM does more than sit idle waiting to be used. ClickHouse spends it on query execution buffers, on the marks cache, and on OS page cache for whatever data counts as hot right now, and none of that is wasted headroom: it's an active, fast layer sitting in front of NVMe. The marks cache (mark_cache_size) defaults to 5 GB and gets raised to somewhere between 10 and 20 GB on larger clusters, while OS page cache for hot data typically claims a large share of whatever RAM a node has.
NVMe disk is the second layer, and it's the one this whole sizing exercise is really about. It holds whatever doesn't fit in RAM but still needs sub-second, low-millisecond access, and capacity planning has to target this tier specifically.
J|Skipping that distinction runs the errors in both directions. A team that sizes only for disk, ignoring how much RAM already absorbs, will underestimate how much hot data is already being served from memory and end up over-provisioning NVMe at real cost. Flip it around: a team that sizes for RAM alone and never sizes the NVMe tier discovers that any hot dataset bigger than available memory routes straight to S3. Neither mistake is theoretical. Both come from treating "cache" as one number instead of two interacting ones.
Measuring the true footprint of your hot dataset before writing a single capacity number
Before any capacity target gets written down, the actual size of the hot dataset needs measuring, and that measurement starts with raw ingestion math. Multiply raw row size by ingestion rate by seconds per day to get daily raw volume, then divide by a measured or expected compression ratio to land on daily compressed volume. ClickHouse typically achieves 5–10× compression on time-series and log data. Carry that forward and 30-day retention at that rate requires roughly 16.2 TB of compressed storage, before a recommended headroom allowance, which brings the total meaningfully higher.
Because ClickHouse exploits both OS page cache (RAM) and NVMe disk simultaneously, sizing "the cache" without distinguishing the two layers produces a number that is guaranteed to be wrong. Hot dataset footprint is not the same as total retention: hot footprint is the subset of that compressed volume touched by queries within the access recency window, and a 30-day store may have only a few days of genuinely hot data. D|Everything older is retained rather than active, and sizing NVMe for the full retention window instead of the active window means paying for capacity nothing will actually use.
Codec choice moves the footprint number directly, and that shifts the cache size target too. G|ZSTD(3) applied to cold or archive columns beats LZ4 by roughly 20% to 50% on compression, Delta codec should run ahead of ZSTD on any monotonically increasing column, and Gorilla codec fits float-based sensor or metric columns well. None of that is optional detail. A pre-migration codec audit, applying the right codecs to a representative sample of production data and measuring the resulting compressed size, gives the footprint input to use for the cache calculation instead of the raw or compressed-by-default size.
Partition strategy decides whether the line between hot and warm data is sharp or blurry. Using PARTITION BY toYYYYMM(timestamp) paired with a matching TTL rule turns the hot data boundary into a decision made at the schema level, rather than something estimated at runtime after the fact. Get the partition key right early and the rest of the sizing math has a clean edge to work from instead of a guess.
Translating hot-data footprint into an NVMe capacity target with a 30% headroom rule
With the compressed hot-data footprint measured, the capacity target itself is fairly simple arithmetic: hot footprint plus merge headroom, sized so the move_factor trigger never fires during normal operation. F|In practice, teams running hybrid or S3-backed setups size the NVMe cache disk at roughly 20% to 30% of the working set, and that headroom serves as the buffer against early moves. It's the buffer that keeps move_factor from firing early and pushing hot data down to the warm or cold tier in the middle of a workload.
The move_factor setting controls exactly when ClickHouse starts shifting parts to the next tier down, defining the fullness threshold that triggers the move and how aggressively or cautiously those moves happen. This value must be set before migration day, not discovered after the NVMe tier fills unexpectedly under production load. Get move_factor wrong and hot data can spill to S3 even when the NVMe tier has capacity to spare on paper.
Replica topology adds a multiplier that's easy to miss. Each replica keeps its own full copy of the data, so the NVMe capacity target needs multiplying by the replica count rather than being treated as something replicas share.
Network bandwidth deserves a mention here too, quietly, because it's easy to overlook until it isn't. A 1 Gbps link bottlenecks a hybrid ClickHouse setup almost as soon as the warm or cold tier lives somewhere remote, so a WAN connection, whether VPN or Direct Connect, needs enough real bandwidth to support remote S3 as a cold tier before that architecture gets relied on.
Reference targets from the oneuptime.com sizing guide (2026) scale roughly like this: small workloads under 1 TB/day suit 2 shards, 2 replicas, 4 nodes, and 32 GB RAM each; medium workloads 1–10 TB/day suit 4 shards, 2 replicas, 8 nodes, and 64 GB RAM each; large workloads over 10 TB/day suit 8+ shards, 2–3 replicas, 16+ nodes, and 128 GB RAM each. Treat those as a sanity check against the footprint-driven number, not a substitute for it.
Pressure-testing the capacity target against NVMe's throughput ceiling before migration
Capacity is only half the equation. A target that fits comfortably on paper can still push queries to S3 at runtime if NVMe throughput runs out under concurrent merges, inserts, and queries all competing for the same drive, so throughput needs validating on its own terms, separately from capacity.
NVMe's whole architecture exists to exploit internal parallelism: the spec supports tens of thousands of queues, each holding tens of thousands of entries, against legacy AHCI's single command queue. That's the structural reason NVMe outperforms SATA SSD on sustained analytical workloads, not simply a matter of a faster clock speed somewhere. But ClickHouse's default I/O configuration doesn't automatically reach into that queue depth on its own, so pre-migration tuning is what closes the gap between what the hardware can do and what the software actually asks of it.
A|A handful of settings need validating before migration day. Set the I/O scheduler to none on NVMe devices, since NVMe already manages its own internal queuing and the kernel scheduler only adds overhead on top of that. For random-read workloads, set read_ahead_kb to 0; for sequential scans, a moderate read-ahead value around 128 KB tends to help instead. Raise background_pool_size and background_merges_mutations_concurrency_ratio, since NVMe can sustain far more concurrent background operations than a SATA SSD ever could. Raise max_insert_threads too: on NVMe, disk I/O is rarely what bottlenecks inserts, and CPU saturation is the more likely limit.
Where the hardware allows it, multiple NVMe devices can run as JBOD inside ClickHouse's storage_configuration, spreading writes across disks natively without the overhead RAID would add, and that setup multiplies effective throughput for high-ingestion workloads.
None of this replaces an actual test. Running clickhouse-benchmark against a representative query set, on the real target hardware, before a single row migrates, gives a p99 figure that can be checked against the NVMe and S3 numbers from the March 2026 benchmark. D|If p99 drifts toward the S3 side under load, the bottleneck is throughput, and no amount of adding disk space fixes it.
L|Sizing NVMe for agentic and exploratory workloads
Deterministic workloads produce cache miss rates that are, more or less, predictable. Agentic ones don't. AI-driven applications are collapsing the old line between transactional and analytical databases: systems that used to run fixed, hard-coded queries now throw off bursts of agent-driven requests with no predictable sequence or volume. C|A single agent run can generate hundreds of observations across chained LLM calls and tool calls, and the useful signal is rarely at the top of that trace. Finding it means running evaluation workflows that probe wide, often unpredictable, stretches of the dataset.
That changes the economics of a cache miss. A human analyst who hits a slow query usually retries once and moves on. An agent pipeline retries across many parallel branches at once, and each S3 fallback gets multiplied by however many concurrent threads the agent is running. The cost of undersizing doesn't scale linearly here. It scales with concurrency.
The practical fix is to add a buffer on top of whatever footprint the human-query analysis produced, sized to agent concurrency, and to keep the error on the side of more NVMe rather than less. Isolating agents to read-only, sandboxed compute over shared data is a sound architectural choice for safety, but it doesn't reduce how much query volume hits the hot tier. It only contains where the blast radius lands if something goes wrong.
Per-query pricing models make the stakes sharper still. Teams paying per query get penalized for exactly the kind of high-curiosity access pattern agentic workloads produce, and sizing the NVMe tier generously up front is the infrastructure-side answer to a problem that per-query billing otherwise pushes onto the invoice.
Running the benchmark before migration: a concrete pre-migration validation protocol
Every number produced so far, footprint, headroom, move_factor, throughput ceiling, is a hypothesis until it's tested against representative data on real hardware. Running that test before migration day is what turns this from an educated guess into an engineering calculation with a verified answer behind it.
The sequence follows directly from the sections above. Pull actual bytes_on_disk figures from system.parts in the source system, broken down by partition, disk, and time range, to get the empirical hot footprint rather than a theoretical one. H|Apply the codec audit from the measurement stage to a representative data sample and use that compressed size as the input to the capacity formula. M|Severalnines reports that practitioners size the NVMe cache disk to 20–30% of the working set for hybrid or S3-backed setups. Apply the NVMe I/O tuning settings, scheduler, read-ahead, background pool size, max_insert_threads, on the target hardware before running anything at scale. Then run clickhouse-benchmark against a query set that actually resembles production traffic, including any agentic or exploratory access patterns expected after cutover, and compare the resulting p99 latency against the NVMe and S3 figures from the March 2026 benchmark.
If that p99 number holds close to the NVMe side, the sizing calculation has passed its test. If it drifts toward the S3 figure under load, something in the chain, capacity, headroom, move_factor, or raw throughput, needs revisiting before migration day arrives, not after the first production query falls through to the wrong tier.
Sources
- How to Benchmark ClickHouse on Different Storage Types
- How to Estimate ClickHouse Cluster Size for Your Workload
- How to Tune ClickHouse for NVMe Storage
- NVM Express
- ClickHouse Storage Architecture and Optimization | Severalnines
- ClickHouse
- How to Configure Hot/Warm/Cold Storage Policies in ClickHouse
- How to Implement Data Tiering in ClickHouse