Why Your p99 Looks Fine in Staging and Breaks in Production
Averages hide the slowest requests that matter most at scale.
What p99 looks like in a production system that appears healthy
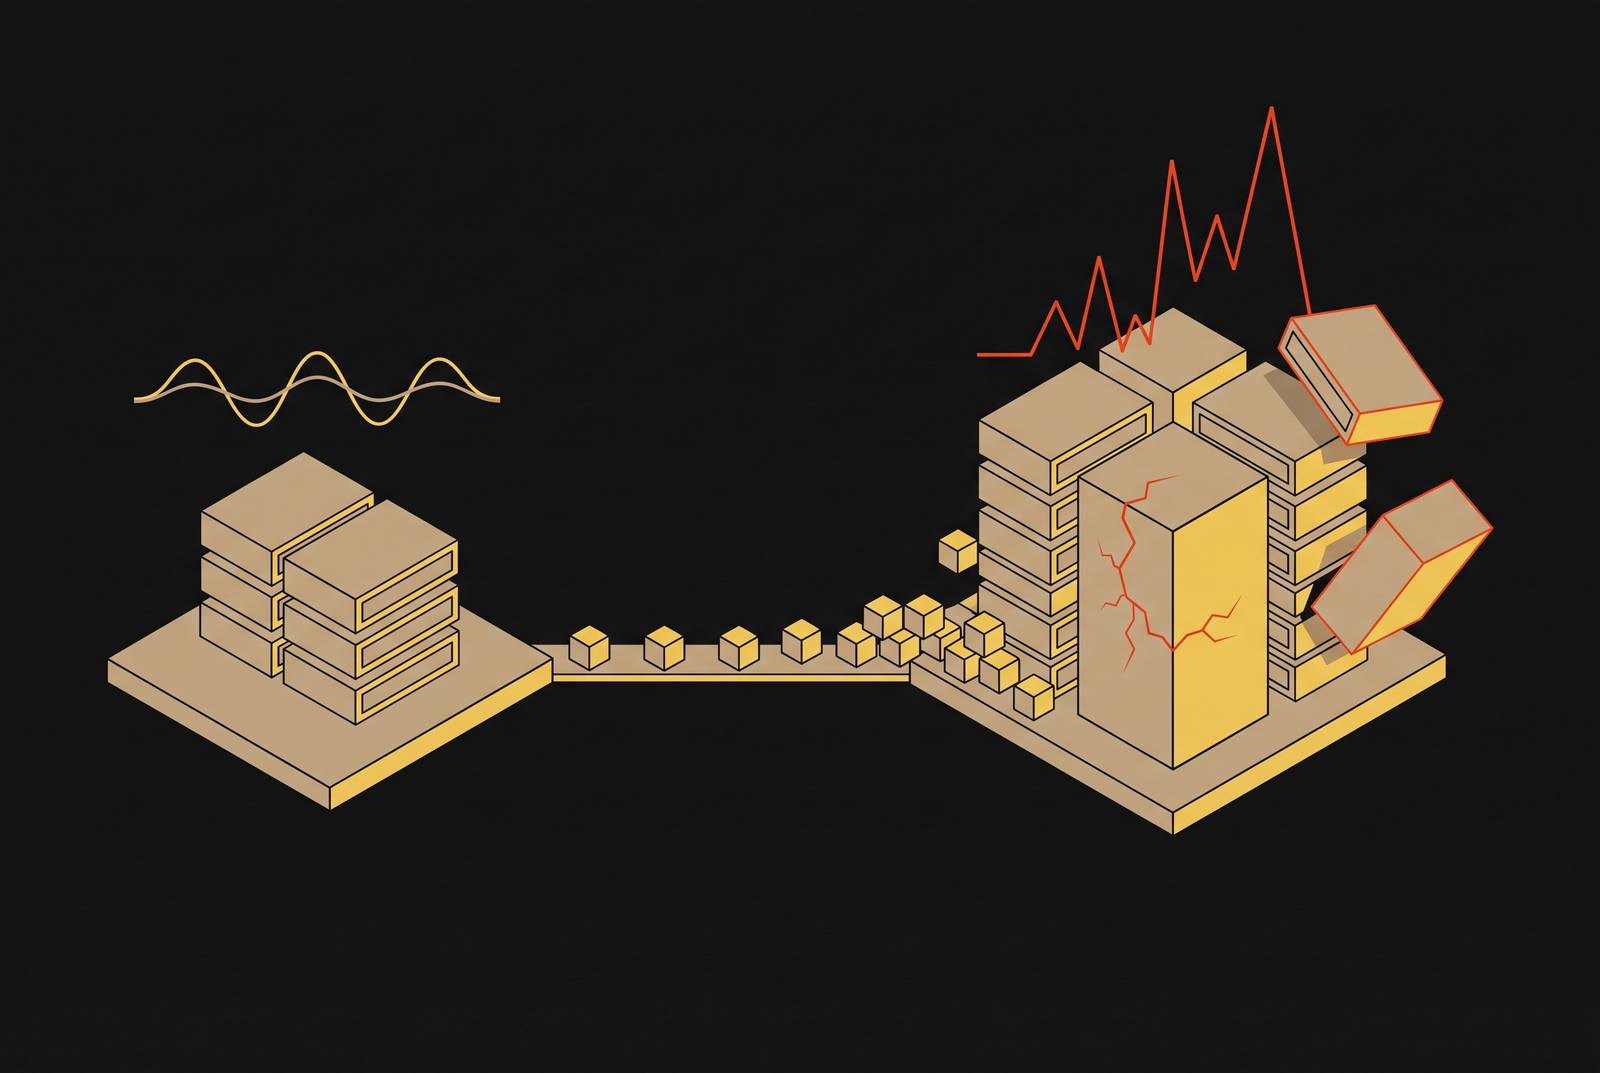
A fintech payment gateway running 500,000 queries per second had a p50 sitting steady around 10ms. Dashboards were entirely green. But the slowest 1% of requests exceeded 300ms, close enough to breach the SLA on a transaction path where actual money moves. The average never moved, so nobody caught it by watching the average. That's the trap: p99 is a rank-and-select operation, not a mean. Sort every request duration in the window and read off the value at the 99th-percentile position. No averaging happens anywhere in that process, so the pile of fast requests does not dilute p99.
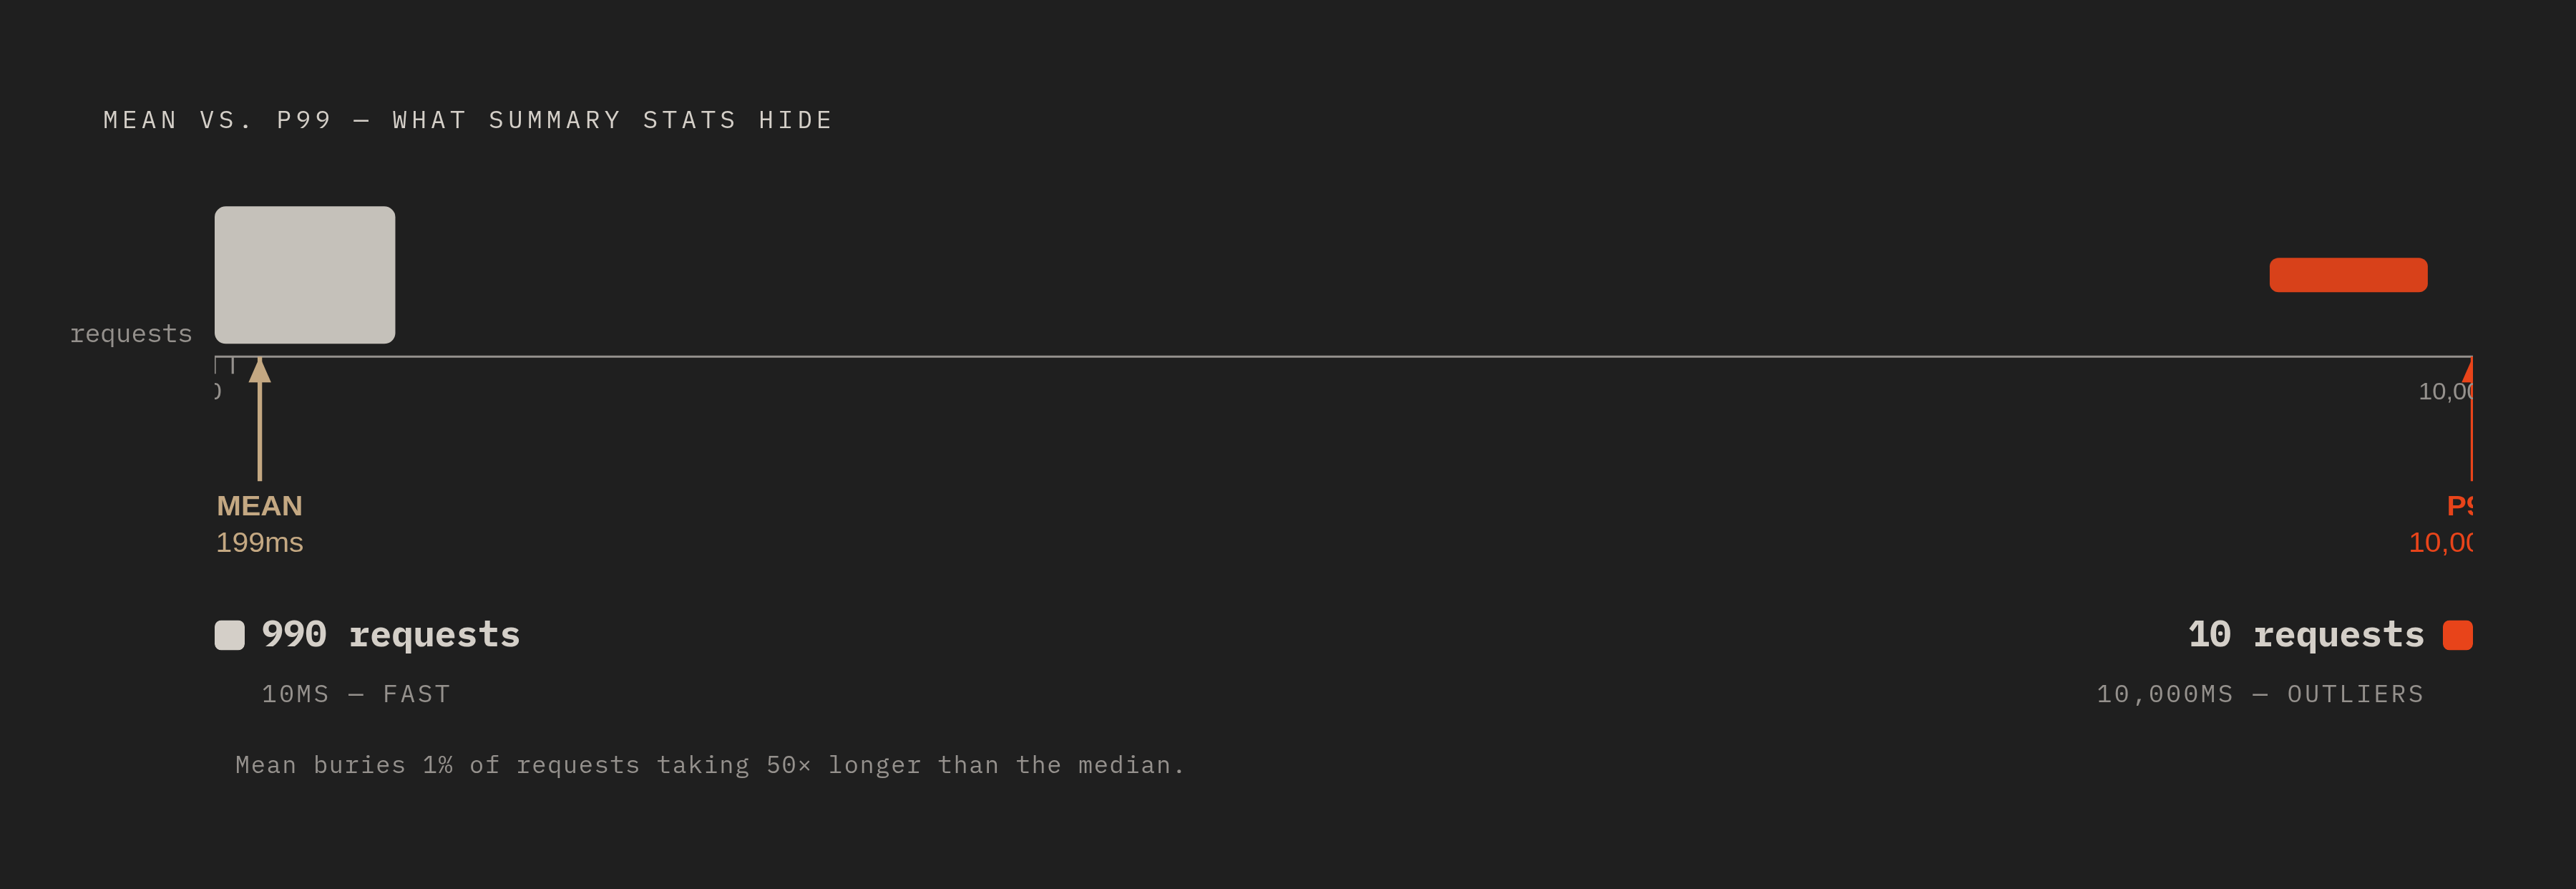
Averages fail here for a structural reason, not just an imprecise one. Latency has a hard floor (nothing finishes in negative time) but no ceiling. Garbage collection pauses, lock contention, a cold cache: all of these push the slow end outward with no real limit. Take 990 requests finishing at 10ms and 10 requests finishing at 10,000ms. Mean latency comes out to 199ms. p99 is 10,000ms. The average hides that gap completely, and it hides it precisely when the gap matters most.
The Google SRE book, via Rob Ewaschuk, makes the point cleanly: at 100ms average latency across 1,000 requests, 1% might easily take 5 seconds. Chain a few services together and the p99 of one backend becomes the median experience of a frontend calling it repeatedly. Slow tails don't stay contained to the service that produced them; they travel downstream and become somebody else's problem there.
Scale changes what that 1% costs in practice. At 10,000 requests per second, 1% is 100 people every single second sitting in the slow lane. At 500,000 requests per second, where a lot of fintech and large SaaS backends now run, that's thousands of people per second feeling the tail while every aggregate metric on the dashboard reads fine.
A D-language order service showed the same pattern from a different angle: p99 climbed from a 120ms baseline to 350ms while routine checks returned nothing. The problem wasn't sitting in any single component, it was the kind of failure a component-by-component check is built to miss.
Call this the "works on my dashboards" pattern: flat average latency, zero error rate, low CPU, and a real tail-latency problem that aggregate reporting hides by diluting slow requests into the mass of fast ones by design. But the spread between p50 and p99 is a diagnostic if you read it right. A median of 10ms next to a p99 of 500ms points to a specific class of problem, usually a query that occasionally falls back to a full scan instead of a seek, and it tells you exactly which users are unlucky enough to land in that slow path.
Why staging cannot statistically produce a valid p99
Sample size is the first wall staging hits, and it's a real statistical constraint, not a matter of taste. Producing one meaningful data point in the tail takes something like 100 requests in the measurement window. Below that, p99 and p999 lack the sample depth to be statistically meaningful.
Percentiles don't average, either, and this catches teams even when volume looks fine. If ten servers each report their own p95, averaging those ten numbers does not give a valid fleet-wide p95. The underlying histogram data has to get combined first, then the percentile gets recomputed from that combined distribution. Staging, running a sliver of the fleet, usually can't do this correctly even when someone tries.
Traffic pattern is the deeper issue. Staging concurrency runs low enough that lock conflicts, connection pool exhaustion, and thread starvation either never happen or happen at thresholds nothing like production's. And staging's traffic is bursty in ways that have nothing to do with real usage, a CI runner spinning up cold, a deploy pipeline hammering an endpoint for thirty seconds. That noise dominates the staging tail. The structural outliers that dominate a production tail never get the chance to appear.
Staging and production don't just differ in size. They differ in behavior:
- A query fast against a small staging table hits index limits the moment the table crosses whatever row count production actually runs at
- Locks that never conflict in staging start contending once production traffic converges on the same rows or partitions at real concurrency
- Cache warming, connection pooling, background maintenance jobs, all of it behaves differently against production-sized data
- A staging environment sized at 5% of production capacity simply never generates the concurrent load where these mechanisms kick in
The specific conditions that create tail latency at production scale
Garbage collection pauses are a clean starting point, because the mechanism is simple and the scale dependency is exact. A GC pause stops one thread and every request it's holding. At low concurrency, that's a blip nobody notices. At high concurrency, every request arriving during that pause queues up behind it, and the delay compounds across the queue. Heap sizing and GC tuning are the fix, but the problem itself doesn't exist at staging request rates. There's nothing to trigger it, so there's nothing to tune against.
Database query tail latency is the failure mode staging misses most often. At small data volumes, every query runs fast, more or less regardless of whether it takes an efficient path or a bad one; the gap between a seek and a scan barely registers when the whole table sits in memory. At production scale, the query that happens to fall into a full scan becomes the tail, and it becomes the tail because staging never had enough data to expose that gap.
Column-oriented databases built around sparse indexing make this concrete. A sparse index stores one entry per block of rows rather than per row, say one value for every 8,192 rows. At small volumes that index sits comfortably in memory and skipping past irrelevant blocks is fast almost every time. At petabyte scale, when the value you're after falls between two index entries, the engine has to read up to 16,384 rows just to confirm one match. Invisible in staging. A measurable, recurring contributor to the tail in production.
Nullable columns carry a similar hidden cost. Every nullable column needs a second column behind the scenes, a null mask, just to track which rows are null: extra storage, extra memory loaded per query, an extra check on every operation that touches that column. None of that registers at staging row counts. At production column widths, it compounds quietly across every query touching that column, staying invisible until it appears in the tail.
Schema decisions ride on top of all this. In a multi-tenant table, if the tenant identifier isn't the leading column in the sort order, per-tenant queries lose the ability to skip irrelevant blocks and fall back to scanning far more data than they need. On a small staging dataset that might cost a few milliseconds. In production, it's the gap between a fast query and a full table scan.
Connection and thread pool exhaustion follows the same logic. Pool limits staging traffic never approaches become hard ceilings under real concurrent load. Queuing instead of rejecting outright is the better failure mode, but queue depth itself becomes a tail contributor the moment requests arrive faster than the queue can drain.
Then there's compounding latency across hops, easy to forget because it's structural, not a bug sitting in one component. A real request path runs client to edge or CDN, across the network, through ingress, through a service mesh, into the application, out to the database, and back. p99 at the end of that chain is the 99th percentile of the sum across every hop. Staging rarely replicates the full hop count and almost never replicates the variance at each individual hop, so the compounding effect across the whole chain just doesn't exist in the test environment.
Agentic workloads that expose tail latency production load tests miss
Agent traffic doesn't look like human traffic, and most load testing plans don't account for the query and concurrency patterns that difference produces. A single agent conversation can fire off dozens of queries in sequence. A fleet of concurrent agents can generate thousands of queries in exploratory, unpredictable patterns probing different slices of the data on every run, unlike the predictable bursts a load test script assumes. Human traffic tends to hit the same paths repeatedly, warming caches along the way. Agents wander instead.
The pattern is worth naming directly: autonomous agents can generate high query volumes with no coordination between them, producing traffic spikes that look anomalous against any baseline built on human usage.
That kind of traffic amplifies tail latency in ways production load tests aren't built to catch:
- Agents land on cold code paths human traffic never touches, exactly the O(n) queries and backtracking regex patterns that sit dormant until the wrong input arrives They retry, and retries stack directly onto queue depth
The right answer on the database side is treating agents as their own query persona, with isolated, read-only compute so their exploratory load doesn't contend with the paths serving real users. Share compute between the two and an agent's cold-path full scan, or its GC pause, becomes part of the p99 a human customer feels. Full logging on every agent query matters too. Autonomous doesn't mean unaccountable, and the tail latency an agent introduces stays invisible right up until it's the subject line of an incident review.
How to collect p99 measurements that are valid
Two shortcuts recur constantly, and both are wrong. Storing every raw request duration in memory to compute an exact percentile gets expensive fast at real volume. Averaging previously computed percentiles across instances isn't a shortcut at all, it's mathematically invalid: averaging each server's own p95 does not produce a valid fleet-wide p95.
The right approach uses structures built for exactly this problem: HDR Histograms, t-digest, or OpenTelemetry's histogram instruments, which bucket request durations and let the backend compute quantiles from the bucketed data afterward. None of these require holding every raw value in memory, and all of them aggregate correctly across a fleet.
A load test that wants a trustworthy p99 has to replicate four things at once, not just one:
- Enough traffic volume for the tail buckets to reflect real request behavior rather than sparse noise
Watch for p99 diverging sharply from p50. A large spread between the two catches structural divergence between the typical request and the tail, and it stays meaningful regardless of the service's overall speed profile.
ClickHouse-specific schema and architecture decisions affecting p99 at scale
Sparse indexing is a genuinely good design, but it's a production-scale tool, and staging never puts enough pressure on it to reveal where it bends. A traditional B-tree index on a large table produces a large number of entries and a real memory cost. A sparse index storing one entry per block of rows fits far more compactly in memory than a traditional row-level index, and a binary search over those entries tells you which blocks to actually read.
At staging volumes, block skipping looks fast every time, nothing to worry about. At production scale, the boundary cases start to bite: when a target value falls between two index entries, the engine may read an entire granule of rows to confirm one match. The physical sort order on disk, set by the ORDER BY clause, determines how often that boundary case happens. Get the column order wrong and it's invisible in staging. In production, granule skipping becomes expensive because of this, and it's usually the first place to look when p99 drifts without an obvious cause.
Nullable columns carry a tax nobody sees until row counts get large. Each one carries overhead to track nulls: extra storage, extra memory pulled into every query, an extra check on every operation. Negligible at staging row counts. At production column widths and query frequencies, it becomes a real, quiet contributor to the tail, one no staging benchmark will surface because staging never has enough rows for the overhead to add up to anything visible.
The append-only design of a log-structured storage engine introduces a different failure mode. Every insert creates a new, independent part on disk, and a background merge process consolidates the small parts into larger ones over time. Unbatched, high-frequency inserts create a merge storm: too many small parts competing with actual query execution for the same I/O bandwidth. That contention pattern occurs only at real production ingestion rates. Watch for inconsistent insert performance, a growing count of small unmerged parts, and insert latency bleeding into whatever downstream process depends on that data landing on time, those are the warning signs before the p99 impact becomes obvious on a dashboard.
Schema design, in the end, is a p99 control as much as a data modeling decision. Joins carry real cost at production scale in a column store built for scan-and-aggregate workloads. Denormalizing ahead of time, rather than joining at query time, is the pattern that holds up, keeping the hot query path down to a single table scan against a well-chosen sort order instead of a join across several tables.