P99 Latency Stability Under Data Volume Growth Across OLAP Engines
Tail latency gets worse as data grows, not better, across most OLAP engines.
P99 latency, not average latency, is the right lens for judging an OLAP engine, because it measures the experience that decides whether a system actually works for the people using it. Average latency hides the slowest requests, and those slow requests tend to come from your most active users: the analyst pulling a six-month window instead of a single day, the query touching a larger slice of the dataset than most. A dashboard made of twenty widgets only feels as fast as its slowest one. Nineteen charts can load instantly, but if the twentieth spins for three seconds, the whole page reads as broken to the person staring at it.
The cost of a bad tail grows with how many steps a task takes. A distributed system, an AI agent, or any workflow built from many calls in sequence will run into tail latency on almost every run, simply because each call is another chance to draw a slow one. At that point p99 is no longer a diagnostic number tucked into a dashboard; it's the thing the product actually delivers. The stakes rise further in businesses where latency is written into a contract. Fraud signals and ad-tech bidding systems often carry SLAs measured in milliseconds at the tail, not on average. A system can report a perfectly healthy mean latency and still blow through those SLAs, triggering financial penalties and straining the partnerships those contracts protect. It isn't a side effect of scale; it's the measurement that tells you whether the system holds up once real users and real data volume show up.
How the scatter-gather execution model makes p99 structurally sensitive to data volume
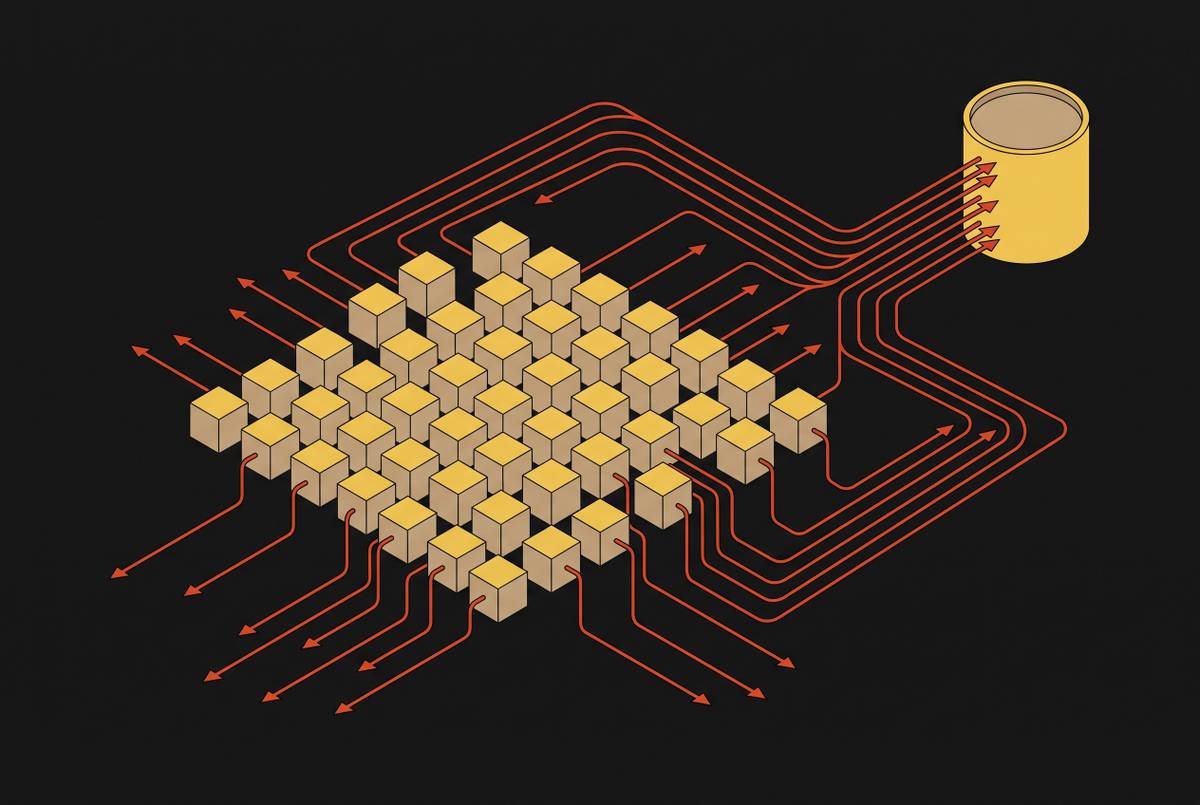
Most OLAP engines answer a query by splitting it apart. A coordinator breaks the query into sub-queries, sends them out to the shards holding the relevant data, and waits for every shard to come back before it can assemble a final answer. That waiting step is where tail latency gets built into the architecture. If even one shard out of a hundred runs slow, the whole query runs slow, because the coordinator can't respond until the last straggler reports in.
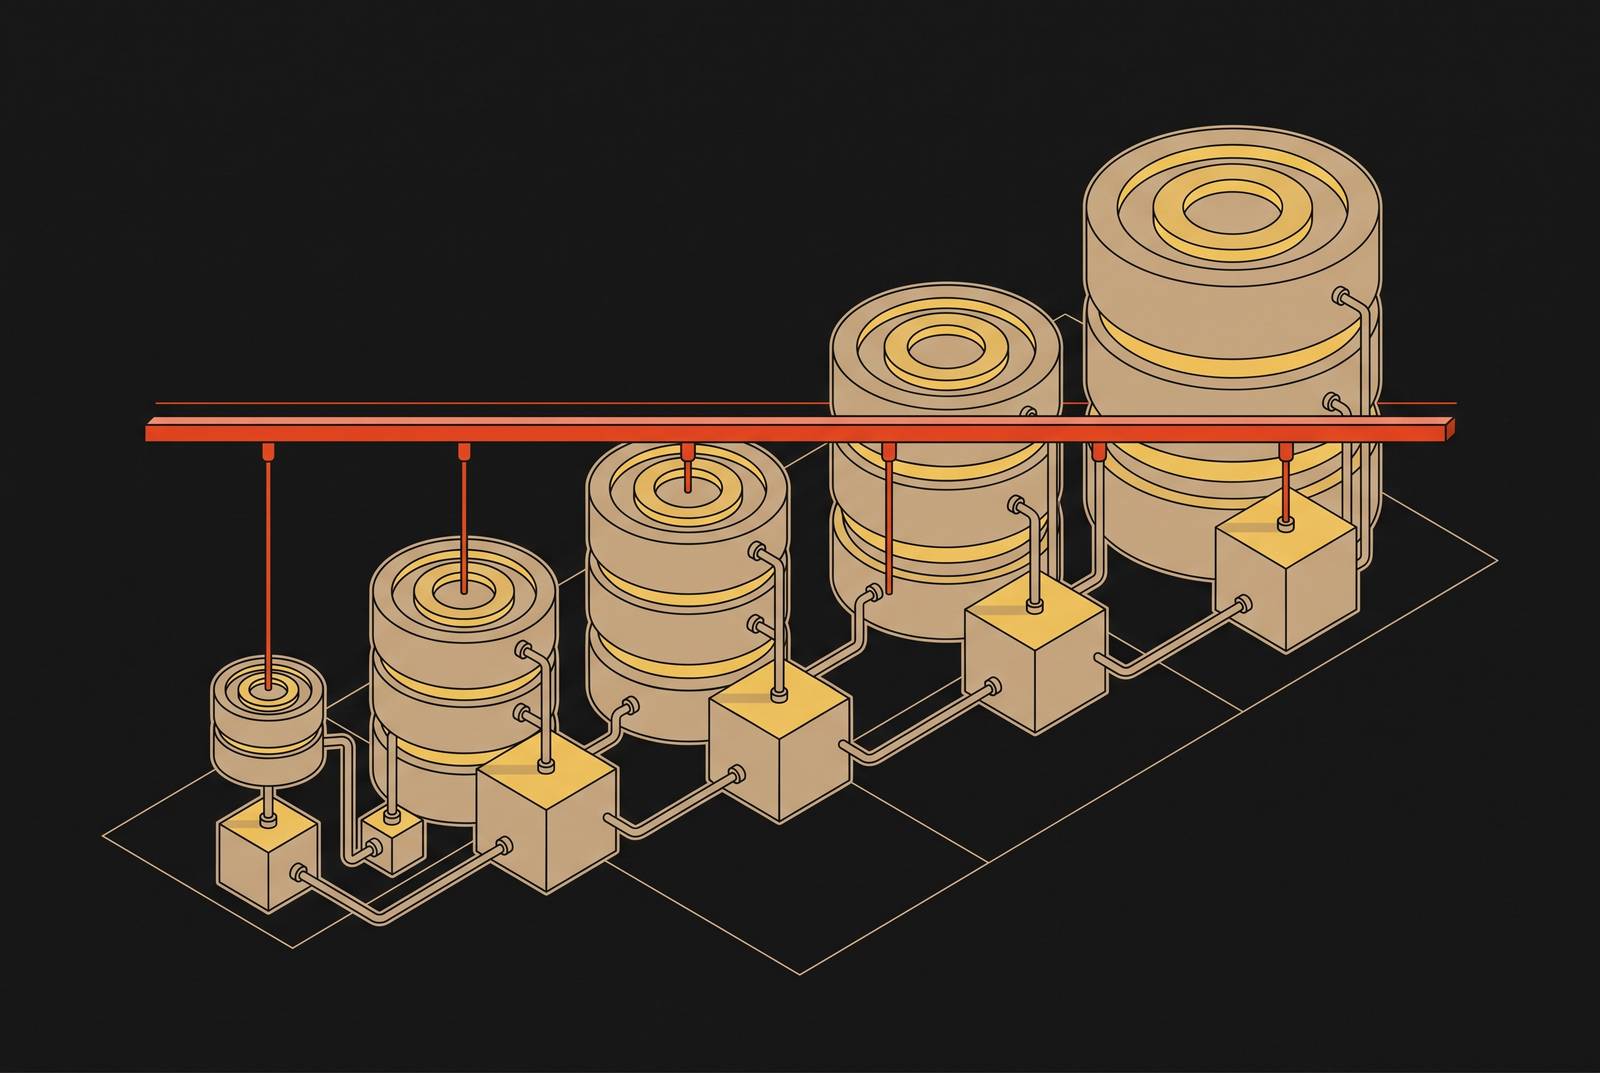
The math behind this explains why adding more shards doesn't solve the problem. When a query fans out wide enough, the p99 latency of a single shard effectively becomes the median latency of the entire query. Spreading a query across more nodes without reducing the variance on each node doesn't fix anything. It just gives the query more chances to hit a slow one. And as tables grow, queries have to touch more shards to cover the same logical question, which widens that fan-out further. The same query, run against a bigger table, has a higher chance of hitting at least one slow shard every time it runs. An engine that holds a steady p99 today carries no guarantee that it'll hold the same p99 once the table doubles, because the mechanism producing the tail scales right alongside the data.
Stripe's deployment of Apache Pinot shows what it looks like to engineer around this rather than hope it doesn't happen. Pinot executes sub-second, petabyte-scale aggregation queries over financial event data, hitting p99 latency of 70 milliseconds at high query volume across 3 petabytes. That number proves the problem can be engineered around with the right design choices, and that stable p99 at large volume takes deliberate work rather than arriving by default.
Compaction backlogs as a second volume-driven source of p99 variance
Fan-out isn't the only mechanism working against the tail. Compaction is the background process column-oriented OLAP engines rely on to keep reads fast. Ingestion piles up a stream of small segment files, and compaction merges them into bigger, more efficient files so that scans don't have to wade through thousands of fragments to answer a query. Without it, read performance degrades steadily as data piles in.
Compaction doesn't raise average latency so much as it spikes the tail. It runs in bursts, and during those bursts it competes with live queries for I/O and CPU. A query that happens to execute while compaction is mid-burst gets caught in the contention and runs slow. Most queries don't land during one of those windows, so the average stays healthy even as the p99 jumps. That's the shape of the problem: a metric that looks fine on a dashboard while a meaningful share of requests are quietly getting hit.
Volume makes this worse in a direct way. Bigger tables mean more data to compact, longer compaction cycles, and more overlap between compaction windows and the hours when queries are actually running. At high ingest rates, the backlog can grow faster than compaction clears it, so the contention doesn't stay occasional; it becomes routine. When a vendor points to "network blips" as the explanation for intermittent slow queries, the real cause often sits inside the cluster the whole time. Query execution and background compaction are competing for the same I/O and CPU, and in many analytical systems, that competition is the actual source of the spike. Fixing it takes workload isolation: keeping compaction's I/O demands from sharing resources with query execution. That's a deliberate design choice, and most engines don't make it well without being configured to.
S3-Routed Reads and the Latency Tax of Volume Growth
The third mechanism sits in how an engine stores and retrieves data. Architectures that route every query read through cloud object storage carry a per-read latency cost, and that cost compounds as data volume grows. Object storage like S3 was built for durability and for storing enormous amounts of data cheaply, not for the sub-millisecond access times that an OLAP engine needs when answering a query on hot data. Any read that misses the local cache has to pay the round-trip to object storage, and that round-trip is measured in a different order of magnitude than a local disk or memory read.
Volume growth makes this tax heavier over time. As tables get bigger, the working set a typical query touches expands with them. At smaller data volumes, a warm cache can absorb most of that traffic, and reads rarely need to leave the local tier. At larger volumes, cache hit rates fall, a growing share of reads fall through to S3, and the floor under p99 rises accordingly. Object storage also has rate limits and can degrade in performance at the bucket level more often than vendors tend to advertise, and when that happens, error rates and latency both climb in ways that can take down the service sitting in front of it.
The Apache Pinot project took this problem on directly rather than treating cloud storage as a drop-in replacement for local disk. To keep sub-second p99 latencies while still using cloud storage, Pinot's architecture adds pipelining, prefetching, and selective block fetches, and it balances data between local and cloud storage to manage both cost and speed. The fact that this work exists says something on its own: routing reads through S3 without this kind of engineering does not hold p99 at scale. The vendor pitch of "infinite elastic scale" on shared-disk, S3-backed architectures holds up for storage capacity. It does not hold up for read latency, which gets worse as the ratio of hot data to cache capacity grows.
p99 at Current Data Volume vs. p99 at Planned Volume
Fan-out, compaction, and storage round-trips are each manageable on their own at small scale, but they compound at large scale, and an evaluation that doesn't trigger any of the three failure modes at your current data volume can still leave you with a false sense of security. Most teams run their benchmarks against today's table sizes, because that's the data sitting in front of them and the resources they've already provisioned. That's a reasonable place to start testing, but it tells you almost nothing about whether the engine holds up once the table has grown by an order of magnitude, which is when the failure typically appears in production, months after the evaluation closed.
Catching this requires asking different questions of a benchmark than most teams default to. A benchmark should show p99 at multiple data volumes, not a single scale point, because a single number from a single size tells you where the engine stands today and nothing about the slope. The workload behind each of those numbers should stay identical across volume levels, so that any change in latency can be traced to volume growth rather than to a shift in what the queries are actually asking for. A trustworthy benchmark also separates p99 under read-only load from p99 under concurrent ingestion, since ingestion triggers compaction, and compaction is where the real tail behavior tends to appear. And the hot-data path matters just as much as the numbers: whether queries are served from something local, like NVMe or an in-memory cache mesh, or routed through object storage determines how badly cache hit rates degrade as the table grows. Benchmark data that doesn't hold up to comparison on identical workloads, at multiple volumes, isn't evidence, it's marketing dressed up as a number. The practical approach for evaluating platforms in 2026 starts with setting non-negotiable SLAs, such as sub-second query latency for customer-facing dashboards, before any platform comparison begins, and then checking a vendor's architectural claims against real benchmark behavior to find the costs that don't appear in the pitch deck.
What production deployments at scale reveal about which architectural choices hold p99
Theory only goes so far. What production systems running at real volume show is that holding p99 steady takes more than one fix. The deployments that manage it tend to address fan-out, compaction, and storage overhead together, not by leaning on a single optimization and hoping it covers the rest.
LinkedIn runs Apache Pinot behind more than 50 user-facing applications, serving queries at millisecond latency across hundreds of billions of records. That's a direct demonstration that sub-second p99 can hold at that record count when the system underneath it is built for the job. Stripe's Pinot deployment handles sub-second, petabyte-scale aggregation over financial event data in real time, with p99 latency of 70 milliseconds during peak transaction periods. That figure comes from a live Black Friday transaction load rather than a controlled lab run. DoorDash's move to Pinot cut query latency from 30-second timeouts down to under 100 milliseconds for real-time analytics across its risk and ads platforms, and the 30-second figure is a useful marker in its own right: it shows what the tail looks like when fan-out and storage overhead go unaddressed. Walmart's Pinot deployment ingests millions of events per minute from Kafka with under 900 milliseconds of lag, which demonstrates that stable p99 is achievable even under the kind of heavy concurrent ingestion that puts the most pressure on compaction.
The common thread across these four deployments is that each one required deliberate engineering: balancing local and object storage, isolating ingestion workloads from query workloads, and tuning fan-out rather than just scaling it wider. None of these outcomes came from a default configuration. They came from teams treating p99 at scale as something to design for.
AI Agents and the p99 Calculus for OLAP Infrastructure
Everything above assumes a human is the one asking the questions. AI agents break that assumption, and they raise the stakes on every mechanism already described. A human analyst runs a query and waits for the result. An agent working through a multi-step task might make dozens of sequential calls to the database, and each one is an independent roll against that engine's tail latency. Even a small, fixed probability of hitting the tail on any single call adds up fast across a long chain of calls. Run that math out across a workflow with enough steps, and tail latency occurs on roughly every other run.
Agents also complicate the fan-out problem in a second way. Many issue queries in parallel rather than one at a time, so the application layer is now fanning out on top of the fan-out the OLAP engine already performs internally. That's two separate scatter-gather layers stacked on top of each other, each with its own tail events waiting to happen. Freshness adds another layer of pressure: agents making decisions tied to real money, inventory, or customer experience can't work from data that's hours old on a batch refresh cycle. They need sub-second freshness, and they need it delivered with a stable tail, because a slow or stale result in the middle of a multi-step task doesn't just delay the outcome. It can produce an error that compounds through every step that follows.
Handling this well takes the same resource-isolation principle already discussed for human workloads, just applied at a much higher volume: agent queries need isolated, read-only compute over shared data, so a curious agent doesn't eat into the compaction and I/O budget that production queries depend on. Every one of those queries should also be logged in full. Autonomous doesn't mean unaccountable, and at agent-driven query volumes, trying to reconstruct what happened from partial logs after the fact isn't realistic. A per-query pricing model also taxes agents directly, since an agent that probes data relentlessly will generate far more queries than any human ever would, and that kind of pricing can make genuinely useful, high-curiosity agent behavior too expensive to run. None of this changes the underlying mechanisms covered earlier. It just means fan-out, compaction, and storage overhead now register as a product reliability question, not a minor UX annoyance.
The architectural choices that determine whether p99 stays flat as your data grows
Stable p99 at scale is the outcome of specific design decisions an engineering team can look for, test for, and choose before committing to a platform.
On fan-out, look for engines that bound how many shards a given query actually has to touch, through intelligent partitioning, sorted indices, and pruning, rather than engines that just throw more parallelism at the problem. More parallelism without less per-shard variance only widens the surface area where a slow shard can wreck the whole query. On compaction, look for explicit resource isolation between the I/O that compaction needs and the I/O that live queries need, and ask directly whether a vendor publishes p99 figures measured under concurrent ingest load, not just benchmarks run against a quiet, already-settled dataset. On storage, ask whether the hot-data path runs locally, through NVMe or an in-memory cache mesh, or whether it's routed through object storage, since that answer determines how badly cache hit rates, and p99 along with them, degrade as the data grows. None of these questions has a universal right answer independent of workload and budget. Asking them before signing a contract, rather than after the table has grown past the point the original benchmark ever tested, turns p99 stability from a hope into a design decision made with the numbers in hand.