SLO vs SLI Definitions for Database Query Performance
Separate SLOs for agent queries prevent misleading reliability metrics as AI workloads grow.
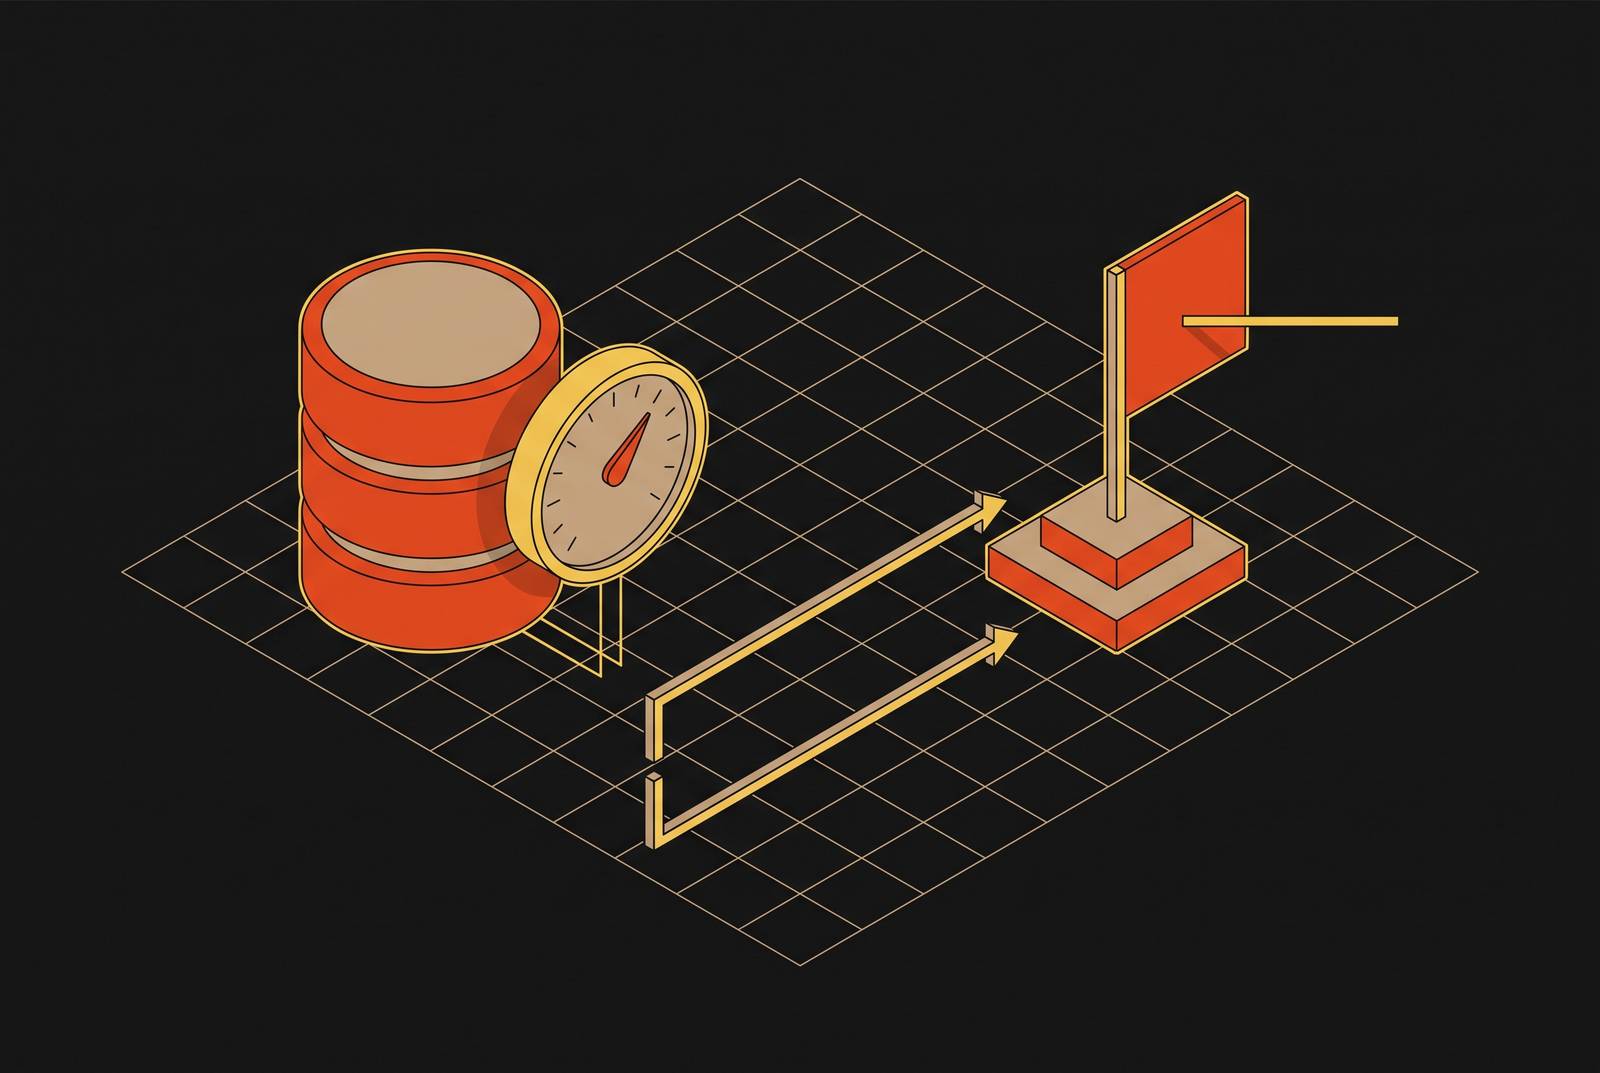
An SLI is a ratio of good events to total events, while an SLO sets a target for that ratio over a defined window and compliance period. ObsessionDB shows how query-level measurement and isolated agent compute can help teams do this, especially when human and agent workloads share data.
Why "uptime percentage" fails as a database reliability measure
Consider an on-call meeting where two engineers disagree about whether the database met its target last week. One points to uptime, while the other points to slow queries. Both may have measured correctly, but to settle the argument they must agree on what counts as a good user-visible event. A database can remain available while failing to return results quickly enough for the work it serves.
The same ambiguity sits inside a statement such as “1000ms latency”. It leaves open which requests count, how many must meet the threshold, and over what period. CPU utilization and replication lag can help explain what went wrong, but neither tells the team whether users got useful results. Even an index scan success rate needs a clear connection to the user’s request before it can stand for reliability. The team needs a shared counting rule.
The structural difference between an SLI and an SLO
That counting rule is the service level indicator, or SLI. An SLI is good events divided by total events, expressed as a percentage. The percentage of requests that complete in under 1000ms is an SLI, whereas the latency threshold alone is not. The ratio names the event, the condition for success, and the denominator. Once those choices are explicit, two engineers can compute the same number from the same records.
A service level objective, or SLO, adds a target and time boundaries to that ratio. It must specify the threshold, the required percentage, the measurement window, and the compliance period. A window-based objective might require p99 latency under 500ms within 1-minute windows, then set the share of windows that must be good over a rolling 30-day period. Here, the events counted by the final SLI are windows.
The service level agreement, or SLA, is the external promise to customers. It is set less strictly than the internal SLO, leaving room to detect and fix a problem before it becomes a contractual breach.
A daily target and a monthly target can use the same percentage yet permit very different patterns of poor service. For a managed service such as ObsessionDB, compute-hour pricing makes the execution window relevant to cost as well as performance. The SLO therefore needs to reflect the economic window over which the service is billed, rather than treating time as a detail added after the target.
Why OLTP and OLAP databases require different SLI choices
A precise definition does not produce one universal database SLI, because different workloads have different good events. For OLTP, the event is usually an individual read or write transaction. Those transactions can count as good service when they succeed and have sub-100ms tail latency. Read latency, write success rate, and error rate therefore belong close to the center of the reliability model. Expressed as ratios, they describe the share of transactions that succeed or meet the relevant latency threshold.
OLAP events are query completions against large scan volumes, where a useful answer may reasonably take seconds. Wide denormalized tables and star schemas reduce join fan-out, shifting performance risk toward scan throughput and columnar compression. At petabyte scale, those factors make a transactional latency threshold a poor definition of success. Yet dashboard queries can still need sub-second responses, so they cannot be grouped indiscriminately with heavier analytical queries. A pooled p99 obscures the distinction between these workloads, while a mean hides the tail within each.
For real-time analytics, ObsessionDB’s always-hot cache architecture keeps hot data in memory and takes S3 routing out of the query path. That design bears directly on whether sub-second query thresholds remain attainable as data grows. It does not, however, make a dashboard query and a large analytical scan equivalent. The SLI still needs separate workload scopes and good-event definitions.
OLAP also needs a freshness measure because a fast answer can contain old data. Its underlying observation is the time between the newest business timestamp available to queries and the current time. To turn that observation into an SLI, the numerator counts fixed-interval samples within the freshness threshold, and the denominator counts all eligible samples. Sampling at the output port matters because a load that has started has not necessarily made its data available.
How error budgets convert SLOs into an engineering decision tool
Once an SLO has a defined ratio and period, its complement becomes an error budget. The budget is 1 minus the SLO target, applied to the eligible events or windows in that period. It expresses a finite allowance for poor service. Without the counting rule, a team cannot defend how much of that allowance remains or what consumed it. With the rule, reliability and delivery speed become a measurable trade-off.
The useful scope is two to three SLOs per service, usually covering success rate and latency, with an optional business measure such as job completion rate. A high-nines target may sound disciplined, but distributed databases need substantial redundancy, automation, and on-call investment to sustain it. Such a target also leaves little room for planned maintenance. New services should start with looser objectives, discover their failure modes, and tighten targets from observed behavior.
If database processing takes 50ms but network and application overhead make the wait 300ms, an end-to-end latency objective must reflect 300ms. Measuring only the faster internal span spends the budget on paper while hiding the user’s delay. Even a correctly measured budget, however, depends on the traffic pattern used to calibrate it. The human-driven pattern assumed so far changes sharply when agents begin issuing queries.
How agentic query traffic breaks the assumptions baked into existing database SLOs
Agent deployment changes both the size and the composition of an SLI’s denominator. Agents make many tool calls per session, including parallel probes, schema introspection, and repeated variations on a query. As that traffic grows non-linearly, a pooled ratio can still look good while agent sessions slow down. The calculation need not be wrong for the conclusion to be misleading. The population being measured has changed beneath a target calibrated for human traffic.
When calls run in sequence, their delays add up, so p99 query latency in the seconds can stretch a session into minutes. Agent-facing endpoints therefore need p95 and p99 visibility rather than a mean, with tighter latency expectations than background or batch work. One database framework that works with agent tools uses a p95 tool-call target under 600ms and tracks p99 for its own use, without making it a formal SLO. It distinguishes moderate-complexity queries from writes and puts operations likely to run long into asynchronous tasks.
Separate measurement becomes more useful when the architecture also separates the workloads. ObsessionDB gives agents isolated, read-only compute over shared data, so teams can manage their objectives and error budgets apart from those for production human queries. Logging every agent query in full gives teams the records they need to check the denominator. Sandboxed branches also keep experimental agent queries outside the production population.
New SLI categories that agentic and AI-native database workloads require
The usual latency and availability measures show that a query returned, but agent tasks also need retrieval quality, accuracy, and response completeness. A retrieval-quality SLI counts results that meet its defined quality condition out of all eligible results, while a task-accuracy SLI counts tasks that succeed out of all eligible tasks. Cost per successful task is a useful underlying measure, but it becomes an SLI only when good tasks are defined against a cost threshold.
Latency also needs several layers, including time to first token, time to final token, tool-call completion, and end-to-end journey time. OpenTelemetry’s generative AI metric conventions include the time the model-server takes per token after the first token. That finer decomposition helps distinguish where time goes, but it does not replace the ratio or its target. For databases that work with agent tools, tool-call completion rate must also keep synchronous and asynchronous operations separate. A timed-out tool call and a query returning an error are different events, so their treatment must be explicit.
Freshness and completeness become especially important when stale data can produce errors that compound across an agent session. Their good-event definitions need stable timestamps and a known schema. With ObsessionDB’s CHKit, agents have structured commands to describe, validate, test, and deploy schemas and pipelines as code. That supports a stable interpretation of the query population and what counts as a valid result. Once those indicators are defined, the measurement infrastructure has to capture their events at the right boundary.
Instrumentation choices that determine whether database SLIs are measurable in practice
The first instrumentation choice is where the clock starts and stops. For an application-facing objective, measurement belongs as close to the user as possible, such as at the load balancer or API gateway. Engine counters remain useful for diagnosis, but they omit network and application work outside the database. For a database query-interface objective, the entry point is the relevant boundary. ObsessionDB’s cache-mesh query path supports measuring compliance there without confusing storage-layer timing with query-level timing.
The next choice is how observations become the promised ratio. Prometheus histogram quantiles can evaluate rolling-window p99 conditions, but a quantile is not itself a good-to-total event ratio. In a window-based SLI, the numerator counts windows passing that condition and the denominator counts eligible windows. In a request-based SLI, the numerator instead counts requests within the latency threshold. The query’s measurement window must match the SLO statement, and alerts need enough lead time for action before a full breach.
Keep malformed client requests, irrelevant bot traffic, and pre-production traffic out of the production denominator. Agent traffic that the service is meant to handle belongs in its defined workload scope. Freshness samples must come from the output port, and counting agent queries requires logging each one in full. Otherwise, the team can produce a precise-looking ratio from incomplete or mismatched evidence.
Applying the complete framework to a real-time analytics database
Consider a real-time analytics service with dashboard users and a separate agent-facing tier. The dashboard event is a query returning a result set, and a good result completes in under 500ms without an error. Scope the denominator to eligible production dashboard queries, excluding the expected failures and non-production traffic already defined. Keep availability, latency, and freshness as the three service objectives so each failure has a clear meaning. This separates a missing answer from a slow answer and a stale answer.
For example, require p99 dashboard query latency under 500ms over any 1-hour measurement window within a rolling 30-day compliance period. This is a request-based latency ratio within each window, with the percentile specifying the required share below the threshold. Count non-error responses separately for availability so that fast errors do not count as healthy service. For freshness, count output-port samples where the newest available business timestamp is within the agreed short interval of the current time. The freshness threshold and sampling cadence must be fixed before that objective can be evaluated.
The agent tier needs its own population and thresholds. Read-only tool calls have a p99 target under 500ms, while aggregation and join queries have their own moderate latency ceiling. The latter ceiling, the availability target, and the freshness interval must be filled in from observed behavior rather than invented to make the statement look complete. ObsessionDB’s compute-storage separation and isolated agent compute support these independent scopes, while full query logging makes their event counts auditable. Any external SLA remains less strict than the internal objectives.
This framework replaces a vague uptime claim with a set of explicit decisions about events, thresholds, ratios, time, and scope. It also exposes unfinished decisions instead of hiding them behind a reassuring percentage. Targets can then tighten as failure modes become known, and each error budget has a defensible meaning. Teams with those definitions can resolve whether last week was good enough in two minutes. Teams without them will have the same meeting again next week.